Taxi Business Plan
City Taxi
Executive Summary
City Taxi is a San Francisco, CA based company, whose mission is to provide reliable, timely, and safe cab services by using complete, in-car credit and debit card access, along with computer-aided dispatch. The company will establish its presence in the industry by acquiring an existing taxi cab association, Mighty Cab, a family-owned business that was formed 12 years ago.
City Taxi will provide complete taxi cab services using the latest equipment and technology to facilitate the travel of individuals in and around the San Francisco area. The company’s products and services show that we are an innovative, forward thinking company that recognizes the need to move with ever-changing customer needs. At City Taxi, our philosophy is one that emphasizes service, and a realization that effective communication is a key component in our business. The company also realizes that, in a competitive environment, flexibility and professionalism maintain that leading edge.
The company has drivers and employees that are helpful, courteous, and fully trained on the use of the computer dispatch system. As an added safety measure for both drivers and passengers, City Taxi cabs are fitted with Global Positioning Systems (GPS), which enable the cabs to be tracked or located in an emergency. All City Taxi cabs will be clean, well maintained, and inspected regularly for safety and comfort.
The company’s strategy is to build reputation and market share by establishing our business offering as a viable alternative to existing taxi cab services in the area. The company’s goal in the next year is pursue an aggressive marketing campaign and from that, penetrate at least 65% of the market share. The company’s long-term goal is be the top rated ground transportation company in San Francisco.
The company’s emphasis is on the dispatch, mobile data, and credit/debit card markets of the taxi industry. In aggregate, these markets are believed to represent potential sales in excess of $119 million as of March 1999. Within these markets, City Taxi will focus on the more lucrative credit card/debit card segment. This segment, when introduced into any area, has started out slow but over a three-year period has increased by 20% each year in Maryland and Virginia, and by 25-35% in New York each year.
Companies with whom City Taxi competes are Transportation, Inc., Capital Cab, Yellow Cab, and Diamond Cab. Their weaknesses are that they do not have the credit/debit card payment option, and some still use the radio dispatch system. The company has a competitive advantage, however, because our technology is unique to the taxi industry in San Francisco. The GPS will enable the company to provide timely service by giving an accurate estimated time of arrival (ETA). The credit/debit card feature will give customers convenience and privacy during the transaction period.
Reliable communications are essential under all circumstances in this business. As such, City Taxi will use the KDT 5000 system. The KDT 5000 system design provides multiple levels of reliability to assure communications will be maintained under the most rigorous condition. The company will also run a state of the art call center that will be established by Rockwell International.
The company is seeking $2.5 million of financing to fund the acquisition of Mighty Cab Association and its initial operations. This funding will cover the purchase of Mighty Cab, marketing, purchase of extra vehicles, software, and hardware. Projected revenues for 1999 to 2001 are $200,000, $1.5 million, and $2.2 million, respectively.
Need real milestones? Establish a clear path for your business with real-world examples. Create your own business plan
1.1 Objectives
The company’s goal in the next year is to pursue an aggressive marketing campaign and from that, penetrate at least 65% of the market share. The company’s goal in the next two to five years is be the top rated ground transportation company in the San Francisco Metro Area by continuously monitoring, evaluating, and following up on customer call-ins.
Key components of City Taxi’s initial strategy can be summarized as follows.
Establish Relationship with Rockwell International. The company is currently working to establish and develop a working relationship with Rockwell International. This will enable City Taxi to lock into the many services that they offer including, but not limited to:
- Managerial
- Call center and customer service efficiency
- Management consulting
- Technology consulting
- Product management
- Continuous improvement
1.2 Mission
The mission of City Taxi is to provide reliable, timely, and safe cab services by using complete in-car credit/debit card access, along with computer aided dispatch.
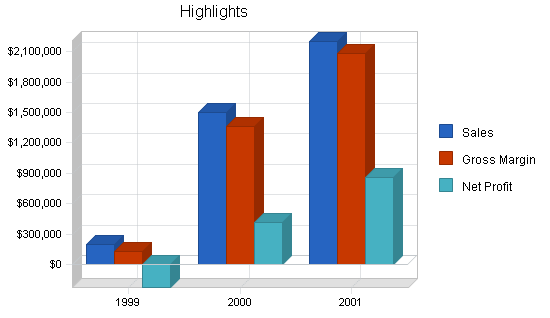
1.3 Highlights
Highlights of City Taxi

Company Summary
Legal Business Description:
City Taxi was founded in 1997 in San Francisco, California, by Mr. Johnson Taylor. The company is a California C-Corporation under the name Patriot, Inc. d.b.a. City Taxi.
2.1 Company Strategy
The City Taxi’s strategy is to saturate the market with television ads depicting the company as a premier taxi service. The company will leverage the newest in car technology to dominate the credit card segment of the market. City Taxi will dominate the market because no other company has this unique feature.
The company’s strategy is to build reputation and market share in our target market by establishing our business offering as a viable alternative to existing taxi cab services. City Taxi intends to get the confidence of customers and establish itself as a company that provides superior customer service by using up to date technology to provide timely and reliable services.
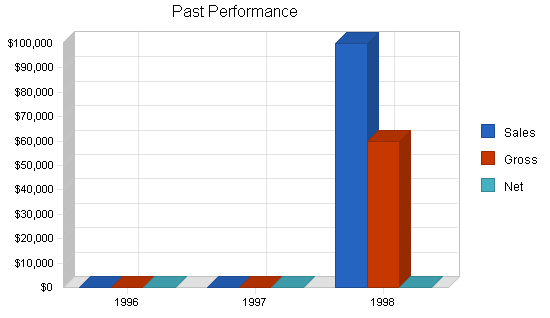
2.2 Company History
As can be seen in the chart and table below, the company performed well its first year, but sales have not been fully actualized. That is the intent of this plan: to increase sales by utilizing our competitive advantages and by the acquisition of a rival taxi company.
Need real financials? Explore a spreadsheet-free path to generating financial data for your business. Create your own business plan
| Past Performance | |||
| 1996 | 1997 | 1998 | |
| Sales | $0 | $0 | $100,000 |
| Gross Margin | $0 | $0 | $60,000 |
| Gross Margin % | 0.00% | 0.00% | 60.00% |
| Operating Expenses | $0 | $0 | $20,000 |
| Balance Sheet | |||
| 1996 | 1997 | 1998 | |
| Current Assets | |||
| Cash | $0 | $0 | $45,000 |
| Other Current Assets | $0 | $0 | $13,400 |
| Total Current Assets | $0 | $0 | $58,400 |
| Long-term Assets | |||
| Long-term Assets | $0 | $0 | $75,000 |
| Accumulated Depreciation | $0 | $0 | $10,000 |
| Total Long-term Assets | $0 | $0 | $65,000 |
| Total Assets | $0 | $0 | $123,400 |
| Current Liabilities | |||
| Accounts Payable | $0 | $0 | $23,600 |
| Current Borrowing | $0 | $0 | $10,000 |
| Other Current Liabilities (interest free) | $0 | $0 | $25,400 |
| Total Current Liabilities | $0 | $0 | $59,000 |
| Long-term Liabilities | $0 | $0 | $25,000 |
| Total Liabilities | $0 | $0 | $84,000 |
| Paid-in Capital | $0 | $0 | $37,000 |
| Retained Earnings | $0 | $0 | $2,400 |
| Earnings | $0 | $0 | $0 |
| Total Capital | $0 | $0 | $39,400 |
| Total Capital and Liabilities | $0 | $0 | $123,400 |
| Other Inputs | |||
| Payment Days | 0 | 0 | 30 |
2.3 Risks
The company recognizes that it is subject to both market and technological risks. The company’s view of its risks, as well as how each is being addressed, is as follows:
2.4 Value Proposition
City Taxi’s products and services offer the following advantages to customers:
Services
City Taxi provides taxi services utilizing computer dispatch to help with timely pick up and quality customer care. The software and hardware systems used by City Taxi give customers convenience by allowing them to use credit and debit cards in the taxi.
3.1 Service Description
Taxi Cab Services
The taxi driver is often the first contact that a visitor has with San Francisco and as such, City Taxi realizes the importance of first impressions and customer care. The company’s customer-oriented philosophy and its commitment to service are reflected in the careful selection of drivers and the comprehensive training program. Customers can expect the following high standards when they travel with City Taxi:
- Clean and tidy taxis
- Friendly and polite drivers
- Careful driving
- Most practical route taken
Maintenance/Repair Services
This division of City Taxi deals with the pure maintenance of vehicles. Drivers will be charged at discounted rates for tune-ups, wheel alignments, and other repairs.
3.2 Technology
GLOBAL POSITIONING SYSTEMS. City Taxi has a unique Global Positioning System (GPS) that pinpoints the nearing driver thus allowing the driver to give an accurate estimated time of arrival.
RADIO SYSTEM. Reliable communications are essential under all circumstances. City Taxi will use the KDT 5000 system design because it provides multiple levels of reliability to assure communications will be maintained under the most rigorous condition.
CREDIT/DEBIT CARD SYSTEM. City Taxi will use the in-car credit/debit card system, which is a new market segment for the taxi industry in San Francisco. This involves customers using their debit cards in any City Taxi cab with approval being given instantly, eliminating the need to dial in to head office for approval numbers. By using this system, the company will be addressing the need for convenience and reliability. City Taxi also features a computer-aided dispatch system which will be represented under the Patriot name. The company is currently in the process of making Patriot a trademark. The company has also applied for a license to run a 490 narrow band frequency and voice data transmission. From the perspective of customers, the advantage of City Taxi’s products and services is the high level of technology, which leads to superior customer service. In contrast to competitors, City Taxi’s products and services offer convenience. The key pad and swipe machine are built into the back seat, thus giving the customer privacy. Whereas competitors have to call in a credit/debit card transaction for approval, our customers will be able to get on-the-spot approval before the driver even pulls over.
3.3 Future Services
City Taxi plans to respond to market needs by following up with taxi plus (wheelchair accessible taxi vans with credit card access inside) with the next 5 years. City Taxi believes it can capture this niche and a gain in overall market share. Additional plans for next generation products and services include rent to own options for our drivers. Introduction of the company’s next generation product and services is expected to be within 12 months.
Market Analysis Summary
The company’s emphasis is on the dispatch, mobile data, and credit/debit card markets of the taxi industry. In aggregate, these markets are believed to represent potential sales in excess of $119 million as of March 1999. Within these markets, City Taxi will focus on the more lucrative credit/debit card segment. This segment, when introduced into any area has started out slow, but over a three-year period has increased by 20% each year in Maryland and Virginia, and by 25-35% in New York each year.
The company believes that the major future trend in the industry will be complete credit card access for consumers. The International Taxi Livery Association (ITLA) forecasts a very steady growth for the taxi industry in the next four years.
Market Size Statistics:
| Estimated number of U.S. establishments | 6,431 |
| Number of people employed in this industry | 49,005 |
| Total annual sales in this industry | $1.34 million |
| Average employees per establishment | 12 |
| Average sales per establishment | $.3 million |
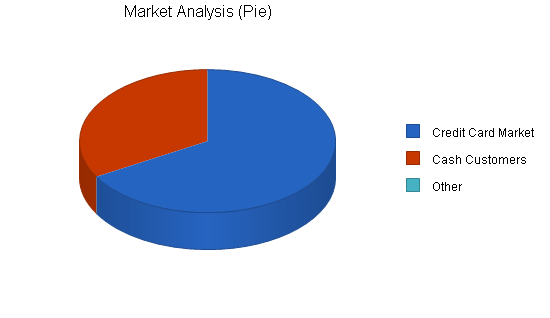
4.1 Market Segmentation
Customers and Target Markets
City Taxi’s focus will be on the credit card market with target customers in the low to mid income range in the Metropolitan San Francisco area. The target customers are motivated to use our services over that of competitors because of the convenience and quality associated with our services.
Customer Buying Criteria
We believe our customers choose our cab service based on the following criteria:
- Performance. We work with one goal in mind: to get customers where they want to go, when they want to go, promptly, efficiently, comfortably, and safely.
- Superior Service. Timely pick up, private usage, and customer care.
- Quality. This involves providing courteous service in clean, well-maintained cars.
- Convenience. This involves the credit/debit card feature.
Need real financials? Explore a spreadsheet-free path to generating financial data for your business. Create your own business plan
| Market Analysis | |||||||
| 1999 | 2000 | 2001 | 2002 | 2003 | |||
| Potential Customers | Growth | CAGR | |||||
| Credit Card Market | 25% | 200,000 | 250,000 | 312,500 | 390,625 | 488,281 | 25.00% |
| Cash Customers | 10% | 100,000 | 110,000 | 121,000 | 133,100 | 146,410 | 10.00% |
| Other | 0% | 0 | 0 | 0 | 0 | 0 | 0.00% |
| Total | 20.60% | 300,000 | 360,000 | 433,500 | 523,725 | 634,691 | 20.60% |
4.2 Service Business Analysis
Market 1-Taxi Cabs
This category covers establishments engaged primarily in furnishing passenger transportation by automobiles not operated on regular schedules or between fixed terminals. Taxi cab fleet owners and organizations are included, regardless of whether drivers are hired, rent their cabs, or are otherwise compensated.
Industry Snapshot
In 1990, U.S. consumers spent an estimated $3.17 billion on taxis. That year, approximately 32,600 were employed in the industry as owners, managers, drivers, dispatchers, or mechanics. Since the mid- 1970’s, when a trend toward independent contracting among drivers developed, three out of every four drivers became independent contractors licensed through, and renting their vehicles from, the taxi companies. Overall, the U.S. taxi industry consisted of 205,300 vehicles in 1993. Of these, 170,800 were licensed taxis and 16,600 were hired cars, also referred to as executive sedans or liveries. The remainder was minibuses or vans, many of which were wheelchair-accessible for transporting the elderly and disabled.
Organization and Structure
Most taxi companies followed a similar organizational pattern. Managers, sometimes the company owners’ ran the business, hired drivers, and performed other administrative duties. Dispatchers took calls and assigned cabs to passenger locations. The position of dispatcher once represented a promotion awarded to experienced cab drivers, whose familiarity with the city best qualified them for the job. However, the increase in computer-based dispatching in the early 1990’s prompted cab companies to favor computer skills over specialized knowledge of local geography when filing the dispatcher position.
Regulation of the U.S. taxi industry varied from city to city. While almost all cities had some form of licensing requirements, larger urban areas had the strictest regulations. San Francisco regulations focused on fares charged to customers, with rates assigned to designated zones of the city.
Current Conditions
In 1998, 6,342 taxi fleets, consisting of 144,000 cars, were operating in the United States. On a national level, in the early 1990’s, taxi’s made approximately 2 billion passenger trips a year. Most taxi fleets were small, family-owned businesses or individual partnerships; only 5% were corporations. Almost all operated within a single municipality, and more than half of all taxi companies had fewer than 10 vehicles. In rural areas, companies tended to be extremely small, with 1 to 3 cars available for customers. In cities of 100,000 people, the average fleet size was 20 cars. In urban centers of 200,000 or more people, cab companies retained hundreds of cars and carried more passengers than the multitude of smaller companies combined.
Research and Technology
Although the taxi cab industry was not regarded as demanding in a high degree of technology, several innovations have changed the way businesses operate. Computerized dispatching–in which cabs were tracked by computer and dispatch instructions appeared only to the cab assigned to a call–allowed more efficient assignment of cabs to passengers. Computerization also helped remedy the problem of “fare stealing,” in which one driver intercepts a message meant for another and picks up the first driver’s fare.
Another development likely to change the industry’s focus involved its use of certain radio frequencies. In the late 1980’s and early 1990’s, with investment in cellular and digital communications skyrocketing, taxi cab companies found themselves in possession of a valuable asset in the form of the broadcast frequencies granted them by the Federal Communications Commission. During this time, the FCC, allowing them only two frequencies in any one area, heavily restricted the cellular telephone industry’s use of the airwaves. By the mid-1990’s, some cab-related services, such as New Jersey’s dispatcher Fleet Call, were in a strong position to become players in the burgeoning telecommunications industry.
Industry Leaders
Due to increasing decentralization in the industry, few national taxi corporations were in operation in the early 1990’s. A few companies, however, many of which were owned by larger holding corporations, had operations that reached beyond the local. Figure 1 shows the industry leaders in the San Francisco area and their share of the market.
Figure 1 Breakdown of Market Share in San Francisco.
| Company | Market Share |
| Transportation, Inc. | 38% |
| Capital Cab | 23% |
| Yellow Cab | 13% |
| Diamond Cab | 8% |
| Others | 18% |
| Total | 100% |
Market 2- Taxi top Display
Taxi top display is a market from which City Taxi can gain a substantial amount of revenue. This has been shown to be a viable means of advertising for a number of companies and it is used widely. Figure 2 shows the growth in the taxi top display market segment from 1993.
| 1994 | 1995 | 1996 | 1997 | 3/1998 |
| 600 | 1,670 | 2,000 | 3,500 | 5,000 |
4.2.1 Competition and Buying Patterns
Competitive threats come from existing taxi cab companies in the San Francisco area. Their weaknesses are, however, that they do not have the credit/debit card payment option, and some still use the radio dispatch system. Transportation, Inc. has computer-aided dispatch but no credit card processing capabilities. Capital Cab, Yellow Cab, and Diamond Cab all have radio dispatch with selected drivers accepting credit cards. However, these drivers do not offer in-car processing, approval must be given at the home office.
Taxi Cabs. City Taxi’s competitors include existing taxi cab companies that have been operating in the San Francisco area. Specifically, competitors include:
City Taxi’s competitive advantage is our cutting edge technology which is unique to the taxi industry in San Francisco. The GPS will enable City Taxi to provide timely service by giving an accurate ETA. The credit/debit card feature will give our customers convenience and privacy during the transaction period.
Maintenance and Repair Services. City Taxi’s competitors include the above mentioned companies and general maintenance and repair shops in the area. Some of these operations do not have the capacity to handle a large amount of vehicles. While others may have the capacity, their operations are run in a primitive manner, and City Taxi intends to capitalize on that.
City Taxi’s competitive advantages include the availability of space, operations management, and skilled employees.
Strategy and Implementation Summary
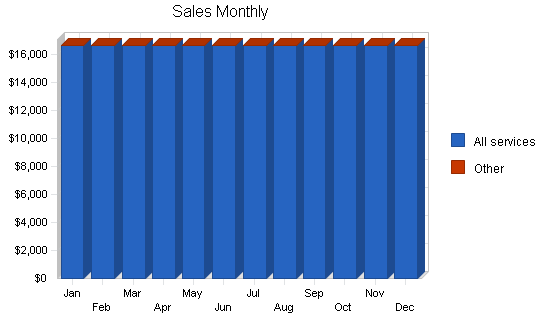
Sales Strategy
At City Taxi, the sales process is the same for each of City Taxi’s two areas: taxi cab services and maintenance and repair services. The company intends to establish its presence online by developing a website from which sales will be generated. The District of Columbia Cab Commission regulates pricing for taxi cab services.
Need impressive charts? Discover the simplest way to create detailed graphs for your business plan. Create your own business plan
| Sales Forecast | |||
| 1999 | 2000 | 2001 | |
| Sales | |||
| All services | $200,000 | $1,500,000 | $2,200,000 |
| Other | $0 | $0 | $0 |
| Total Sales | $200,000 | $1,500,000 | $2,200,000 |
| Direct Cost of Sales | 1999 | 2000 | 2001 |
| All services | $65,000 | $125,000 | $100,000 |
| Other | $0 | $0 | $0 |
| Subtotal Direct Cost of Sales | $65,000 | $125,000 | $100,000 |
5.1 Marketing Strategy
Marketing Strategy
City Taxi markets its products and services as solutions to transportation needs in the city of San Francisco. Other target markets include customers in the low to mid income range. Direct mailings and television advertising will be the company’s main marketing channels. These channels ensure that target customers are reached repeatedly and effectively. The company will monitor its market position through constant tracking by Value Pack and TCI Media, Inc.
TCI Media Services – The proposed advertising package, titled “The Championship,” will yield:
- One commercial in every regular season NBA game on TNT for the 1999-2000 season
- One commercial in 2000; 1999-2000 regular season Wizard games on HTS
- 900 6 a.m. – 12 a.m. commercials on a minimum of 4 networks
- Ads on the TV guide channel
To develop good business strategies, perform a SWOT analysis of your business. It's easy with our free guide and template.Learn how to perform a SWOT analysis
5.1.1 Marketing Programs
City Taxi plans to communicate through direct mail and television advertising to generate sales. TCI MEDIA Services and Val-Pak Direct Marketing will spearhead the marketing campaign. The key message associated with our products and services is cleaner, efficient, flexible, and convenient taxi cabs.
Additional Plans–The company also has additional promotional plans which are diverse and include a range of marketing communications described below:
5.2 Strategic Alliances
The company has strategic alliances with King Communications, Surfside Systems, and Commercial Electronic Services. These alliances are valuable to City Taxi because they allow the company to get updates on technology and added tech support, and they are valuable to the ally firms because City Taxi is a growing customer. All agreements come with a stipulation that if new technology becomes available, City Taxi will be notified and provided with the technology to expand on current technology, helping us maintain a competitive edge. Details of the strategic relationships that City Taxi has are given below.
Management Summary
Organization
The company’s management philosophy is based on responsibility and mutual respect. City Taxi has an environment and structure that encourages productivity and respect for customers and fellow employees.
The City Taxi team is organized into two groups:
Officers and Key Employees
City Taxi’s management is highly experienced and qualified. Key members of City Taxi’s management teams, their backgrounds, and responsibilities are as follows.
- Mr. Johnson Taylor, President and CEO.
- Mr. Peter Jackson, Senior Vice President – Operations.
- Ms. Glenda Jones, Call Center Supervisor.
| Personnel Plan | |||
| 1999 | 2000 | 2001 | |
| Taxi Cabs & Administrative | $108,696 | $365,217 | $395,652 |
| Maintenance & Repair | $108,695 | $156,522 | $169,565 |
| Total People | 8 | 17 | 20 |
| Total Payroll | $217,391 | $521,739 | $565,217 |
Financial Plan
The company is seeking $2.5 million of financing to fund the acquisition of Mighty Cab Association and its initial operations. This funding will cover the purchase of Mighty Cab, marketing, purchase of extra vehicles, software, and hardware.
7.1 Important Assumptions
The table below shows the key assumptions for City Taxi.
| General Assumptions | |||
| 1999 | 2000 | 2001 | |
| Plan Month | 1 | 2 | 3 |
| Current Interest Rate | 10.00% | 10.00% | 10.00% |
| Long-term Interest Rate | 10.00% | 10.00% | 10.00% |
| Tax Rate | 25.42% | 25.00% | 25.42% |
| Other | 0 | 0 | 0 |
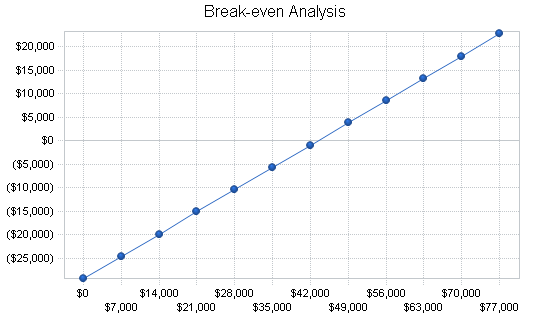
7.2 Break-even Analysis
City Taxi’s Break-even Analysis indicates that the firm has a strong balance of costs and sales. The company estimates a monthly break-even sales volume of approximately $43,000, which will be reached by Fiscal Year (FY) 2000.
Need real milestones? We recommend using LivePlan as the easiest way to create milestones for your own business plan. Create your own business plan
| Break-even Analysis | |
| Monthly Revenue Break-even | $43,333 |
| Assumptions: | |
| Average Percent Variable Cost | 32% |
| Estimated Monthly Fixed Cost | $29,250 |
7.3 Projected Profit and Loss
City Taxi is in the early stage of development, thus initial projections have only been made on accounts that are believed to most drive the income statement.
| Pro Forma Profit and Loss | |||
| 1999 | 2000 | 2001 | |
| Sales | $200,000 | $1,500,000 | $2,200,000 |
| Direct Cost of Sales | $65,000 | $125,000 | $100,000 |
| Other | $5,000 | $10,000 | $15,000 |
| Total Cost of Sales | $70,000 | $135,000 | $115,000 |
| Gross Margin | $130,000 | $1,365,000 | $2,085,000 |
| Gross Margin % | 65.00% | 91.00% | 94.77% |
| Expenses | |||
| Payroll | $217,391 | $521,739 | $565,217 |
| Sales and Marketing and Other Expenses | $64,000 | $164,000 | $214,000 |
| Depreciation | $14,997 | $17,500 | $17,500 |
| Research & Development | $15,000 | $25,000 | $40,000 |
| Utilities | $2,000 | $2,000 | $2,000 |
| Insurance | $5,000 | $5,000 | $5,000 |
| Payroll Taxes | $32,609 | $78,261 | $84,783 |
| Other | $0 | $0 | $0 |
| Total Operating Expenses | $350,997 | $813,500 | $928,500 |
| Profit Before Interest and Taxes | ($220,997) | $551,500 | $1,156,500 |
| EBITDA | ($206,000) | $569,000 | $1,174,000 |
| Interest Expense | $3,337 | $2,841 | $2,084 |
| Taxes Incurred | $0 | $137,165 | $293,414 |
| Net Profit | ($224,334) | $411,494 | $861,002 |
| Net Profit/Sales | -112.17% | 27.43% | 39.14% |
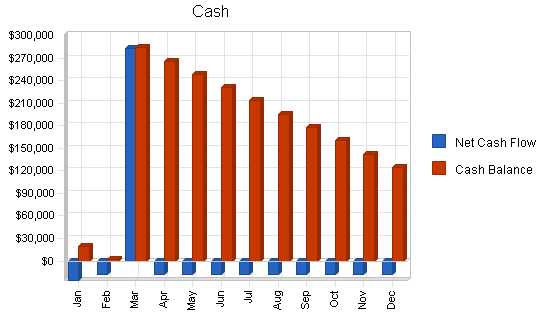
7.4 Projected Cash Flow
The table below outlines the company’s cash flows for FY 1999-2001. The required $2.5 million will be spent to acquire Mighty Cab’s operations ($1.25 million), as well as to purchase additional property ($250,000) and equipment ($200,000). An additional $500,000 will be spent on other short-term assets.
Need real financials? Explore a spreadsheet-free path to generating financial data for your business. Create your own business plan
| Pro Forma Cash Flow | |||
| 1999 | 2000 | 2001 | |
| Cash Received | |||
| Cash from Operations | |||
| Cash Sales | $200,000 | $1,500,000 | $2,200,000 |
| Subtotal Cash from Operations | $200,000 | $1,500,000 | $2,200,000 |
| Additional Cash Received | |||
| Sales Tax, VAT, HST/GST Received | $0 | $0 | $0 |
| New Current Borrowing | $0 | $0 | $0 |
| New Other Liabilities (interest-free) | $0 | $0 | $0 |
| New Long-term Liabilities | $0 | $0 | $0 |
| Sales of Other Current Assets | $0 | $0 | $0 |
| Sales of Long-term Assets | $0 | $0 | $0 |
| New Investment Received | $2,500,000 | $0 | $0 |
| Subtotal Cash Received | $2,700,000 | $1,500,000 | $2,200,000 |
| Expenditures | 1999 | 2000 | 2001 |
| Expenditures from Operations | |||
| Cash Spending | $217,391 | $521,739 | $565,217 |
| Bill Payments | $200,095 | $519,573 | $739,266 |
| Subtotal Spent on Operations | $417,486 | $1,041,312 | $1,304,483 |
| Additional Cash Spent | |||
| Sales Tax, VAT, HST/GST Paid Out | $0 | $0 | $0 |
| Principal Repayment of Current Borrowing | $3,000 | $3,000 | $3,000 |
| Other Liabilities Principal Repayment | $0 | $0 | $0 |
| Long-term Liabilities Principal Repayment | $0 | $4,181 | $4,951 |
| Purchase Other Current Assets | $500,000 | $0 | $0 |
| Purchase Long-term Assets | $1,700,000 | $0 | $0 |
| Dividends | $0 | $0 | $0 |
| Subtotal Cash Spent | $2,620,486 | $1,048,493 | $1,312,434 |
| Net Cash Flow | $79,514 | $451,507 | $887,566 |
| Cash Balance | $124,514 | $576,021 | $1,463,587 |
7.5 Projected Balance Sheet
The table below provides City Taxi’s actual and projected balance sheets for 1999-2001.
| Pro Forma Balance Sheet | |||
| 1999 | 2000 | 2001 | |
| Assets | |||
| Current Assets | |||
| Cash | $124,514 | $576,021 | $1,463,587 |
| Other Current Assets | $513,400 | $513,400 | $513,400 |
| Total Current Assets | $637,914 | $1,089,421 | $1,976,987 |
| Long-term Assets | |||
| Long-term Assets | $1,775,000 | $1,775,000 | $1,775,000 |
| Accumulated Depreciation | $24,997 | $42,497 | $59,997 |
| Total Long-term Assets | $1,750,003 | $1,732,503 | $1,715,003 |
| Total Assets | $2,387,917 | $2,821,924 | $3,691,990 |
| Liabilities and Capital | 1999 | 2000 | 2001 |
| Current Liabilities | |||
| Accounts Payable | $15,451 | $45,145 | $62,160 |
| Current Borrowing | $7,000 | $4,000 | $1,000 |
| Other Current Liabilities | $25,400 | $25,400 | $25,400 |
| Subtotal Current Liabilities | $47,851 | $74,545 | $88,560 |
| Long-term Liabilities | $25,000 | $20,819 | $15,868 |
| Total Liabilities | $72,851 | $95,364 | $104,428 |
| Paid-in Capital | $2,537,000 | $2,537,000 | $2,537,000 |
| Retained Earnings | $2,400 | ($221,934) | $189,560 |
| Earnings | ($224,334) | $411,494 | $861,002 |
| Total Capital | $2,315,066 | $2,726,560 | $3,587,562 |
| Total Liabilities and Capital | $2,387,917 | $2,821,924 | $3,691,990 |
| Net Worth | $2,315,066 | $2,726,560 | $3,587,562 |
7.6 Business Ratios
The following table contains important business ratios from the taxi cab industry, as determined by the Standard Industry Classification (SIC) Index #4121, Taxi Cabs.
| Ratio Analysis | ||||
| 1999 | 2000 | 2001 | Industry Profile | |
| Sales Growth | 100.00% | 650.00% | 46.67% | 0.50% |
| Percent of Total Assets | ||||
| Other Current Assets | 21.50% | 18.19% | 13.91% | 45.90% |
| Total Current Assets | 26.71% | 38.61% | 53.55% | 63.00% |
| Long-term Assets | 73.29% | 61.39% | 46.45% | 37.00% |
| Total Assets | 100.00% | 100.00% | 100.00% | 100.00% |
| Current Liabilities | 2.00% | 2.64% | 2.40% | 29.10% |
| Long-term Liabilities | 1.05% | 0.74% | 0.43% | 27.00% |
| Total Liabilities | 3.05% | 3.38% | 2.83% | 56.10% |
| Net Worth | 96.95% | 96.62% | 97.17% | 43.90% |
| Percent of Sales | ||||
| Sales | 100.00% | 100.00% | 100.00% | 100.00% |
| Gross Margin | 65.00% | 91.00% | 94.77% | 82.50% |
| Selling, General & Administrative Expenses | 177.25% | 63.59% | 55.44% | 58.00% |
| Advertising Expenses | 25.00% | 10.00% | 9.09% | 1.00% |
| Profit Before Interest and Taxes | -110.50% | 36.77% | 52.57% | 2.60% |
| Main Ratios | ||||
| Current | 13.33 | 14.61 | 22.32 | 1.58 |
| Quick | 13.33 | 14.61 | 22.32 | 1.22 |
| Total Debt to Total Assets | 3.05% | 3.38% | 2.83% | 56.10% |
| Pre-tax Return on Net Worth | -9.69% | 20.12% | 32.18% | 3.60% |
| Pre-tax Return on Assets | -9.39% | 19.44% | 31.27% | 8.10% |
| Additional Ratios | 1999 | 2000 | 2001 | |
| Net Profit Margin | -112.17% | 27.43% | 39.14% | n.a |
| Return on Equity | -9.69% | 15.09% | 24.00% | n.a |
| Activity Ratios | ||||
| Accounts Payable Turnover | 12.42 | 12.17 | 12.17 | n.a |
| Payment Days | 31 | 20 | 26 | n.a |
| Total Asset Turnover | 0.08 | 0.53 | 0.60 | n.a |
| Debt Ratios | ||||
| Debt to Net Worth | 0.03 | 0.03 | 0.03 | n.a |
| Current Liab. to Liab. | 0.66 | 0.78 | 0.85 | n.a |
| Liquidity Ratios | ||||
| Net Working Capital | $590,063 | $1,014,876 | $1,888,427 | n.a |
| Interest Coverage | -66.22 | 194.13 | 554.85 | n.a |
| Additional Ratios | ||||
| Assets to Sales | 11.94 | 1.88 | 1.68 | n.a |
| Current Debt/Total Assets | 2% | 3% | 2% | n.a |
| Acid Test | 13.33 | 14.61 | 22.32 | n.a |
| Sales/Net Worth | 0.09 | 0.55 | 0.61 | n.a |
| Dividend Payout | 0.00 | 0.00 | 0.00 | n.a |
Appendix
| Sales Forecast | |||||||||||||
| Jan | Feb | Mar | Apr | May | Jun | Jul | Aug | Sep | Oct | Nov | Dec | ||
| Sales | |||||||||||||
| All services | 0% | $16,667 | $16,667 | $16,667 | $16,667 | $16,667 | $16,667 | $16,667 | $16,667 | $16,667 | $16,667 | $16,667 | $16,667 |
| Other | 0% | $0 | $0 | $0 | $0 | $0 | $0 | $0 | $0 | $0 | $0 | $0 | $0 |
| Total Sales | $16,667 | $16,667 | $16,667 | $16,667 | $16,667 | $16,667 | $16,667 | $16,667 | $16,667 | $16,667 | $16,667 | $16,667 | |
| Direct Cost of Sales | Jan | Feb | Mar | Apr | May | Jun | Jul | Aug | Sep | Oct | Nov | Dec | |
| All services | $5,417 | $5,417 | $5,417 | $5,417 | $5,417 | $5,417 | $5,417 | $5,417 | $5,417 | $5,417 | $5,417 | $5,417 | |
| Other | $0 | $0 | $0 | $0 | $0 | $0 | $0 | $0 | $0 | $0 | $0 | $0 | |
| Subtotal Direct Cost of Sales | $5,417 | $5,417 | $5,417 | $5,417 | $5,417 | $5,417 | $5,417 | $5,417 | $5,417 | $5,417 | $5,417 | $5,417 |
| Personnel Plan | |||||||||||||
| Jan | Feb | Mar | Apr | May | Jun | Jul | Aug | Sep | Oct | Nov | Dec | ||
| Taxi Cabs & Administrative | 0% | $9,058 | $9,058 | $9,058 | $9,058 | $9,058 | $9,058 | $9,058 | $9,058 | $9,058 | $9,058 | $9,058 | $9,058 |
| Maintenance & Repair | 0% | $9,057 | $9,058 | $9,058 | $9,058 | $9,058 | $9,058 | $9,058 | $9,058 | $9,058 | $9,058 | $9,058 | $9,058 |
| Total People | 8 | 8 | 8 | 8 | 8 | 8 | 8 | 8 | 8 | 8 | 8 | 8 | |
| Total Payroll | $18,115 | $18,116 | $18,116 | $18,116 | $18,116 | $18,116 | $18,116 | $18,116 | $18,116 | $18,116 | $18,116 | $18,116 |
| General Assumptions | |||||||||||||
| Jan | Feb | Mar | Apr | May | Jun | Jul | Aug | Sep | Oct | Nov | Dec | ||
| Plan Month | 1 | 2 | 3 | 4 | 5 | 6 | 7 | 8 | 9 | 10 | 11 | 12 | |
| Current Interest Rate | 10.00% | 10.00% | 10.00% | 10.00% | 10.00% | 10.00% | 10.00% | 10.00% | 10.00% | 10.00% | 10.00% | 10.00% | |
| Long-term Interest Rate | 10.00% | 10.00% | 10.00% | 10.00% | 10.00% | 10.00% | 10.00% | 10.00% | 10.00% | 10.00% | 10.00% | 10.00% | |
| Tax Rate | 30.00% | 25.00% | 25.00% | 25.00% | 25.00% | 25.00% | 25.00% | 25.00% | 25.00% | 25.00% | 25.00% | 25.00% | |
| Other | 0 | 0 | 0 | 0 | 0 | 0 | 0 | 0 | 0 | 0 | 0 | 0 |
| Pro Forma Profit and Loss | |||||||||||||
| Jan | Feb | Mar | Apr | May | Jun | Jul | Aug | Sep | Oct | Nov | Dec | ||
| Sales | $16,667 | $16,667 | $16,667 | $16,667 | $16,667 | $16,667 | $16,667 | $16,667 | $16,667 | $16,667 | $16,667 | $16,667 | |
| Direct Cost of Sales | $5,417 | $5,417 | $5,417 | $5,417 | $5,417 | $5,417 | $5,417 | $5,417 | $5,417 | $5,417 | $5,417 | $5,417 | |
| Other | $417 | $417 | $417 | $417 | $417 | $417 | $417 | $417 | $417 | $417 | $417 | $417 | |
| Total Cost of Sales | $5,833 | $5,833 | $5,833 | $5,833 | $5,833 | $5,833 | $5,833 | $5,833 | $5,833 | $5,833 | $5,833 | $5,833 | |
| Gross Margin | $10,833 | $10,833 | $10,833 | $10,833 | $10,833 | $10,833 | $10,833 | $10,833 | $10,833 | $10,833 | $10,833 | $10,833 | |
| Gross Margin % | 65.00% | 65.00% | 65.00% | 65.00% | 65.00% | 65.00% | 65.00% | 65.00% | 65.00% | 65.00% | 65.00% | 65.00% | |
| Expenses | |||||||||||||
| Payroll | $18,115 | $18,116 | $18,116 | $18,116 | $18,116 | $18,116 | $18,116 | $18,116 | $18,116 | $18,116 | $18,116 | $18,116 | |
| Sales and Marketing and Other Expenses | $5,333 | $5,333 | $5,333 | $5,333 | $5,333 | $5,333 | $5,333 | $5,333 | $5,333 | $5,333 | $5,333 | $5,333 | |
| Depreciation | $625 | $625 | $625 | $1,458 | $1,458 | $1,458 | $1,458 | $1,458 | $1,458 | $1,458 | $1,458 | $1,458 | |
| Research & Development | $1,250 | $1,250 | $1,250 | $1,250 | $1,250 | $1,250 | $1,250 | $1,250 | $1,250 | $1,250 | $1,250 | $1,250 | |
| Utilities | $167 | $167 | $167 | $167 | $167 | $167 | $167 | $167 | $167 | $167 | $167 | $167 | |
| Insurance | $417 | $417 | $417 | $417 | $417 | $417 | $417 | $417 | $417 | $417 | $417 | $417 | |
| Payroll Taxes | 15% | $2,717 | $2,717 | $2,717 | $2,717 | $2,717 | $2,717 | $2,717 | $2,717 | $2,717 | $2,717 | $2,717 | $2,717 |
| Other | $0 | $0 | $0 | $0 | $0 | $0 | $0 | $0 | $0 | $0 | $0 | $0 | |
| Total Operating Expenses | $28,624 | $28,625 | $28,625 | $29,458 | $29,458 | $29,458 | $29,458 | $29,458 | $29,458 | $29,458 | $29,458 | $29,458 | |
| Profit Before Interest and Taxes | ($17,791) | ($17,792) | ($17,792) | ($18,625) | ($18,625) | ($18,625) | ($18,625) | ($18,625) | ($18,625) | ($18,625) | ($18,625) | ($18,625) | |
| EBITDA | ($17,166) | ($17,167) | ($17,167) | ($17,167) | ($17,167) | ($17,167) | ($17,167) | ($17,167) | ($17,167) | ($17,167) | ($17,167) | ($17,167) | |
| Interest Expense | $290 | $288 | $285 | $283 | $281 | $279 | $277 | $275 | $273 | $271 | $269 | $267 | |
| Taxes Incurred | $0 | $0 | $0 | $0 | $0 | $0 | $0 | $0 | $0 | $0 | $0 | $0 | |
| Net Profit | ($18,080) | ($18,079) | ($18,077) | ($18,908) | ($18,906) | ($18,904) | ($18,902) | ($18,900) | ($18,898) | ($18,896) | ($18,893) | ($18,891) | |
| Net Profit/Sales | -108.48% | -108.48% | -108.46% | -113.45% | -113.44% | -113.42% | -113.41% | -113.40% | -113.39% | -113.37% | -113.36% | -113.35% |
| Pro Forma Cash Flow | |||||||||||||
| Jan | Feb | Mar | Apr | May | Jun | Jul | Aug | Sep | Oct | Nov | Dec | ||
| Cash Received | |||||||||||||
| Cash from Operations | |||||||||||||
| Cash Sales | $16,667 | $16,667 | $16,667 | $16,667 | $16,667 | $16,667 | $16,667 | $16,667 | $16,667 | $16,667 | $16,667 | $16,667 | |
| Subtotal Cash from Operations | $16,667 | $16,667 | $16,667 | $16,667 | $16,667 | $16,667 | $16,667 | $16,667 | $16,667 | $16,667 | $16,667 | $16,667 | |
| Additional Cash Received | |||||||||||||
| Sales Tax, VAT, HST/GST Received | 0.00% | $0 | $0 | $0 | $0 | $0 | $0 | $0 | $0 | $0 | $0 | $0 | $0 |
| New Current Borrowing | $0 | $0 | $0 | $0 | $0 | $0 | $0 | $0 | $0 | $0 | $0 | $0 | |
| New Other Liabilities (interest-free) | $0 | $0 | $0 | $0 | $0 | $0 | $0 | $0 | $0 | $0 | $0 | $0 | |
| New Long-term Liabilities | $0 | $0 | $0 | $0 | $0 | $0 | $0 | $0 | $0 | $0 | $0 | $0 | |
| Sales of Other Current Assets | $0 | $0 | $0 | $0 | $0 | $0 | $0 | $0 | $0 | $0 | $0 | $0 | |
| Sales of Long-term Assets | $0 | $0 | $0 | $0 | $0 | $0 | $0 | $0 | $0 | $0 | $0 | $0 | |
| New Investment Received | $0 | $0 | $2,500,000 | $0 | $0 | $0 | $0 | $0 | $0 | $0 | $0 | $0 | |
| Subtotal Cash Received | $16,667 | $16,667 | $2,516,667 | $16,667 | $16,667 | $16,667 | $16,667 | $16,667 | $16,667 | $16,667 | $16,667 | $16,667 | |
| Expenditures | Jan | Feb | Mar | Apr | May | Jun | Jul | Aug | Sep | Oct | Nov | Dec | |
| Expenditures from Operations | |||||||||||||
| Cash Spending | $18,115 | $18,116 | $18,116 | $18,116 | $18,116 | $18,116 | $18,116 | $18,116 | $18,116 | $18,116 | $18,116 | $18,116 | |
| Bill Payments | $24,134 | $16,007 | $16,005 | $16,003 | $16,001 | $15,999 | $15,996 | $15,994 | $15,992 | $15,990 | $15,988 | $15,986 | |
| Subtotal Spent on Operations | $42,249 | $34,123 | $34,121 | $34,119 | $34,117 | $34,115 | $34,112 | $34,110 | $34,108 | $34,106 | $34,104 | $34,102 | |
| Additional Cash Spent | |||||||||||||
| Sales Tax, VAT, HST/GST Paid Out | $0 | $0 | $0 | $0 | $0 | $0 | $0 | $0 | $0 | $0 | $0 | $0 | |
| Principal Repayment of Current Borrowing | $250 | $250 | $250 | $250 | $250 | $250 | $250 | $250 | $250 | $250 | $250 | $250 | |
| Other Liabilities Principal Repayment | $0 | $0 | $0 | $0 | $0 | $0 | $0 | $0 | $0 | $0 | $0 | $0 | |
| Long-term Liabilities Principal Repayment | $0 | $0 | $0 | $0 | $0 | $0 | $0 | $0 | $0 | $0 | $0 | $0 | |
| Purchase Other Current Assets | $0 | $0 | $500,000 | $0 | $0 | $0 | $0 | $0 | $0 | $0 | $0 | $0 | |
| Purchase Long-term Assets | $0 | $0 | $1,700,000 | $0 | $0 | $0 | $0 | $0 | $0 | $0 | $0 | $0 | |
| Dividends | $0 | $0 | $0 | $0 | $0 | $0 | $0 | $0 | $0 | $0 | $0 | $0 | |
| Subtotal Cash Spent | $42,499 | $34,373 | $2,234,371 | $34,369 | $34,367 | $34,365 | $34,362 | $34,360 | $34,358 | $34,356 | $34,354 | $34,352 | |
| Net Cash Flow | ($25,832) | ($17,706) | $282,296 | ($17,702) | ($17,700) | ($17,698) | ($17,696) | ($17,694) | ($17,692) | ($17,690) | ($17,687) | ($17,685) | |
| Cash Balance | $19,168 | $1,462 | $283,758 | $266,056 | $248,356 | $230,658 | $212,962 | $195,268 | $177,577 | $159,887 | $142,200 | $124,514 |
| Pro Forma Balance Sheet | |||||||||||||
| Jan | Feb | Mar | Apr | May | Jun | Jul | Aug | Sep | Oct | Nov | Dec | ||
| Assets | Starting Balances | ||||||||||||
| Current Assets | |||||||||||||
| Cash | $45,000 | $19,168 | $1,462 | $283,758 | $266,056 | $248,356 | $230,658 | $212,962 | $195,268 | $177,577 | $159,887 | $142,200 | $124,514 |
| Other Current Assets | $13,400 | $13,400 | $13,400 | $513,400 | $513,400 | $513,400 | $513,400 | $513,400 | $513,400 | $513,400 | $513,400 | $513,400 | $513,400 |
| Total Current Assets | $58,400 | $32,568 | $14,862 | $797,158 | $779,456 | $761,756 | $744,058 | $726,362 | $708,668 | $690,977 | $673,287 | $655,600 | $637,914 |
| Long-term Assets | |||||||||||||
| Long-term Assets | $75,000 | $75,000 | $75,000 | $1,775,000 | $1,775,000 | $1,775,000 | $1,775,000 | $1,775,000 | $1,775,000 | $1,775,000 | $1,775,000 | $1,775,000 | $1,775,000 |
| Accumulated Depreciation | $10,000 | $10,625 | $11,250 | $11,875 | $13,333 | $14,791 | $16,249 | $17,707 | $19,165 | $20,623 | $22,081 | $23,539 | $24,997 |
| Total Long-term Assets | $65,000 | $64,375 | $63,750 | $1,763,125 | $1,761,667 | $1,760,209 | $1,758,751 | $1,757,293 | $1,755,835 | $1,754,377 | $1,752,919 | $1,751,461 | $1,750,003 |
| Total Assets | $123,400 | $96,943 | $78,612 | $2,560,283 | $2,541,123 | $2,521,965 | $2,502,809 | $2,483,655 | $2,464,503 | $2,445,354 | $2,426,206 | $2,407,061 | $2,387,917 |
| Liabilities and Capital | Jan | Feb | Mar | Apr | May | Jun | Jul | Aug | Sep | Oct | Nov | Dec | |
| Current Liabilities | |||||||||||||
| Accounts Payable | $23,600 | $15,473 | $15,471 | $15,469 | $15,467 | $15,465 | $15,463 | $15,461 | $15,459 | $15,457 | $15,455 | $15,453 | $15,451 |
| Current Borrowing | $10,000 | $9,750 | $9,500 | $9,250 | $9,000 | $8,750 | $8,500 | $8,250 | $8,000 | $7,750 | $7,500 | $7,250 | $7,000 |
| Other Current Liabilities | $25,400 | $25,400 | $25,400 | $25,400 | $25,400 | $25,400 | $25,400 | $25,400 | $25,400 | $25,400 | $25,400 | $25,400 | $25,400 |
| Subtotal Current Liabilities | $59,000 | $50,623 | $50,371 | $50,119 | $49,867 | $49,615 | $49,363 | $49,111 | $48,859 | $48,607 | $48,355 | $48,103 | $47,851 |
| Long-term Liabilities | $25,000 | $25,000 | $25,000 | $25,000 | $25,000 | $25,000 | $25,000 | $25,000 | $25,000 | $25,000 | $25,000 | $25,000 | $25,000 |
| Total Liabilities | $84,000 | $75,623 | $75,371 | $75,119 | $74,867 | $74,615 | $74,363 | $74,111 | $73,859 | $73,607 | $73,355 | $73,103 | $72,851 |
| Paid-in Capital | $37,000 | $37,000 | $37,000 | $2,537,000 | $2,537,000 | $2,537,000 | $2,537,000 | $2,537,000 | $2,537,000 | $2,537,000 | $2,537,000 | $2,537,000 | $2,537,000 |
| Retained Earnings | $2,400 | $2,400 | $2,400 | $2,400 | $2,400 | $2,400 | $2,400 | $2,400 | $2,400 | $2,400 | $2,400 | $2,400 | $2,400 |
| Earnings | $0 | ($18,080) | ($36,159) | ($54,237) | ($73,145) | ($92,051) | ($110,954) | ($129,856) | ($148,756) | ($167,654) | ($186,549) | ($205,443) | ($224,334) |
| Total Capital | $39,400 | $21,320 | $3,241 | $2,485,163 | $2,466,255 | $2,447,349 | $2,428,446 | $2,409,544 | $2,390,644 | $2,371,746 | $2,352,851 | $2,333,957 | $2,315,066 |
| Total Liabilities and Capital | $123,400 | $96,943 | $78,612 | $2,560,283 | $2,541,123 | $2,521,965 | $2,502,809 | $2,483,655 | $2,464,503 | $2,445,354 | $2,426,206 | $2,407,061 | $2,387,917 |
| Net Worth | $39,400 | $21,320 | $3,241 | $2,485,163 | $2,466,255 | $2,447,349 | $2,428,446 | $2,409,544 | $2,390,644 | $2,371,746 | $2,352,851 | $2,333,957 | $2,315,066 |