Baseball Batting Cages Business Plan
Barney's Bullpen
Executive Summary
Barney’s Bullpen will be a for-profit North Dakota corporation. We will lease an approximately 15,000 square/ft. facility where we will offer a central, indoor location for guests to learn and practice their baseball and softball skills. The facility will include batting cages, pitching areas, team skills areas, meeting area, equipment rental, & rest area. In addition to the facilities, Barney’s Bullpen will offer specialized group coaching clinics and one-on-one skills training, and will facilitate youth league board meetings.
Youth baseball and softball programs have exploded in popularity over the past 10 years. Informal surveys indicate that facilities offering similar amenities draw guests from up to 40 miles away, if the facilities can provide a safe, clean, state-of-the-art facility for honing baseball and softball skills. Within a 20 mile radius of the proposed facility, there are 4,000+ children in little league baseball, 2000+ in girls softball, 2500+ in adult softball, 300+ in High school Baseball/Softball, and 4 colleges. All of these are potentially regular customers for Barney’s Bullpen.
Parents are looking to give their children an advantage over other children in organized sports activities. Group coaching is simply not enough to give children the proper skills required to play at an above average level in baseball and softball. Private coaches and skill trainers are fully booked by eager parents looking for one-on-one training for their child. “Select” baseball and softball leagues are increasing in popularity and advanced skills training is an absolute requirement for participants in these activities. This indoor facility will cater to the increasing need of individualized skills training on a year-round basis.
Barney’s Bullpen currently has little to no competition within the service area. There is one outdoor batting cage facility located in Cedar Hill, approximately 10 miles away from the proposed location. This facility is closed during inclement weather and has limited utilization during the hot summer months. The next closest facility is in Euless, 20 miles from Duncanville and 40 miles from Waxahatchie. This business was opened in two years ago by two youth league coaches who saw a need for this type of facility. Through personal experience, we found that a two-hour wait was common on winter weekends if you did not have reservations. Weeknights did not require reservations for the batting cages, but one-hour waits were common. The team skills areas require reservations. The indoor competition is open for 53 hours a week while the outdoor facility has a potential of 50 plus hours a week, depending on weather.
Barney’s Bullpen will provide a quality indoor baseball training environment for serious athletes and amateur enthusiasts. We project a conservative facility usage of 20% for the first year and a 25% growth rate for the second year. Barney’s Bullpen is a business that will flourish in the growing sports environment of the Best Southwest area of Dallas county.
1.1 Mission
Barney’s Bullpen will provide a quality indoor baseball training environment for both the serious and the recreation-minded. The primary goal for the Barney’s Bullpen staff is to promote baseball fundamentals of offense and defense for all ages. By focusing on our primary goal, Barney’s Bullpen will provide a service to the local youth, that will in turn generate a positive revenue stream for continued growth.
1.2 Objectives
- Barney’s Bullpen will commence operation in the spring.
- In the first year of operation, we expect a conservative 20% usage.
- For the second year we project a growth rate of 25%.
- For the third year we expect to match the community growth rate of 15%.
1.3 Keys to Success
- Our great location.
- High quality customer service.
- Contracts with skilled local baseball instructors.
- So many options under one roof – customers never get bored!
Need real financials? We recommend using LivePlan as the easiest way to create financials for your own business plan. Create your own business plan
Need actual charts?
We recommend using LivePlan as the easiest way to create graphs for your own business plan.
Barney’s Bullpen will be a for-profit North Dakota corporation. We will lease an approximately 15,000 square/ft. facility where we will offer a central, indoor location for guests to learn and practice their baseball and softball skills. The facility will include batting cages, pitching areas, team skills areas, meeting area, equipment rental, & rest area. In addition to the facilities, Barney’s Bullpen will offer specialized group coaching clinics and one-on-one skills training, and will facilitate youth league board meetings.
Youth baseball and softball programs have exploded in popularity over the past 10 years. Informal surveys indicate that facilities offering similar amenities draw guests from up to 40 miles away, if the facilities can provide a safe, clean, state-of-the-art facility for honing baseball and softball skills. Within a 20 mile radius of the proposed facility, there are 4,000+ children in little league baseball, 2000+ in girls softball, 2500+ in adult softball, 300+ in High school Baseball/Softball, and 4 colleges. All of these are potentially regular customers for Barney’s Bullpen.
Parents are looking to give their children an advantage over other children in organized sports activities. Group coaching is simply not enough to give children the proper skills required to play at an above average level in baseball and softball. Private coaches and skill trainers are fully booked by eager parents looking for one-on-one training for their child. “Select” baseball and softball leagues are increasing in popularity and advanced skills training is an absolute requirement for participants in these activities. This indoor facility will cater to the increasing need of individualized skills training on a year-round basis.
Barney’s Bullpen currently has little to no competition within the service area. There is one outdoor batting cage facility located in Cedar Hill, approximately 10 miles away from the proposed location. This facility is closed during inclement weather and has limited utilization during the hot summer months. The next closest facility is in Euless, 20 miles from Duncanville and 40 miles from Waxahatchie. This business was opened in two years ago by two youth league coaches who saw a need for this type of facility. Through personal experience, we found that a two-hour wait was common on winter weekends if you did not have reservations. Weeknights did not require reservations for the batting cages, but one-hour waits were common. The team skills areas require reservations. The indoor competition is open for 53 hours a week while the outdoor facility has a potential of 50 plus hours a week, depending on weather.
Barney’s Bullpen will provide a quality indoor baseball training environment for serious athletes and amateur enthusiasts. We project a conservative facility usage of 20% for the first year and a 25% growth rate for the second year. Barney’s Bullpen is a business that will flourish in the growing sports environment of the Best Southwest area of Dallas county.
1.1 Mission
Barney’s Bullpen will provide a quality indoor baseball training environment for both the serious and the recreation-minded. The primary goal for the Barney’s Bullpen staff is to promote baseball fundamentals of offense and defense for all ages. By focusing on our primary goal, Barney’s Bullpen will provide a service to the local youth, that will in turn generate a positive revenue stream for continued growth.
1.2 Objectives
- Barney’s Bullpen will commence operation in the spring.
- In the first year of operation, we expect a conservative 20% usage.
- For the second year we project a growth rate of 25%.
- For the third year we expect to match the community growth rate of 15%.
1.3 Keys to Success
- Our great location.
- High quality customer service.
- Contracts with skilled local baseball instructors.
- So many options under one roof – customers never get bored!
Need real milestones? Establish a clear path for your business with real-world examples. Create your own business plan

Company Summary
Barney’s Bullpen will be a for-profit Texas corporation. We will lease an approximately 15,000 square/ft. facility to provide a climate controlled, well-equipped, central location where baseball enthusiasts can come to learn and to practice their baseball and softball skills. This indoor facility will include:
- Iron Mike hitting lanes.
- Individual lanes with portable mounds for pitching or “L” screens for live hitting practice.
- Utility lanes for a variety of drills.
In addition, Barney’s Bullpen will provide these additional services:
- Locally recognized instructors to facilitate clinics for players, coaches, and umpires
- Private instructors for one-on-one hitting and pitching lessons.
- Video analysis of both hitting and pitching.
Due to the growth of youth sports and the unpredictable weather in North Texas, indoor facilities are needed to allow our youth to be competitive with teams with access to year-round training facilities.
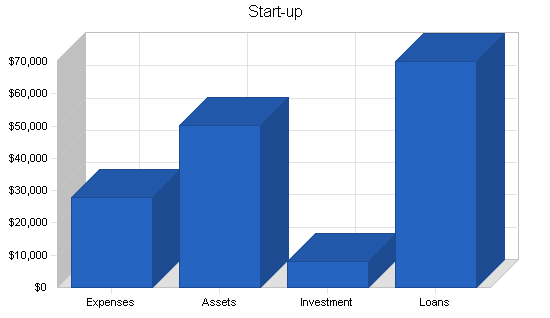
2.1 Start-up Summary
We need less than $80,000 of start-up funding to cover the costs associated with opening our business. We will finance these start-up costs through investment and an SBA loan. The details are shown in the following table and chart.
Need impressive charts? Discover the simplest way to create detailed graphs for your business plan. Create your own business plan
| Start-up | |
| Requirements | |
| Start-up Expenses | |
| Legal | $0 |
| Advertising | $2,500 |
| Utilities/Deposits | $2,500 |
| Insurance / 1 yr | $10,000 |
| Special use permit | $1,100 |
| Rent Deposit | $6,250 |
| Contractor services | $3,500 |
| Freight Charges | $2,000 |
| Other | $0 |
| Total Start-up Expenses | $27,850 |
| Start-up Assets | |
| Cash Required | $3,000 |
| Other Current Assets | $11,150 |
| Long-term Assets | $36,000 |
| Total Assets | $50,150 |
| Total Requirements | $78,000 |
| Start-up Funding | |
| Start-up Expenses to Fund | $27,850 |
| Start-up Assets to Fund | $50,150 |
| Total Funding Required | $78,000 |
| Assets | |
| Non-cash Assets from Start-up | $47,150 |
| Cash Requirements from Start-up | $3,000 |
| Additional Cash Raised | $0 |
| Cash Balance on Starting Date | $3,000 |
| Total Assets | $50,150 |
| Liabilities and Capital | |
| Liabilities | |
| Current Borrowing | $0 |
| Long-term Liabilities | $70,000 |
| Accounts Payable (Outstanding Bills) | $0 |
| Other Current Liabilities (interest-free) | $0 |
| Total Liabilities | $70,000 |
| Capital | |
| Planned Investment | |
| Barney Crouch | $2,000 |
| Jen Crouch | $6,000 |
| Additional Investment Requirement | $0 |
| Total Planned Investment | $8,000 |
| Loss at Start-up (Start-up Expenses) | ($27,850) |
| Total Capital | ($19,850) |
| Total Capital and Liabilities | $50,150 |
| Total Funding | $78,000 |
2.2 Company Ownership
Barney’s Bullpen has been created as a Limited Liability Corporation based in North Dakota, owned by Barney and Jen Crouch. The legal name is listed as Barney’s Bullpen, LLC.
Services
Barney’s Bullpen is a new company dedicated exclusively to the promotion and enhancement of baseball/softball skills to local residents regardless of age or gender.
We will achieve this goal by providing the following services:
- Hitting lanes with Iron Mike pitching machines.These lanes can be rented for $25 per 1/2 hour or for $40 per hour. These lanes will also be available as coin operated machines, where $1 gets 20 pitches. 4 lanes will be set up for baseball and 2 will be set up for softball.
- Utility lanes.These lanes will be approximately 14′ x 70′ in size. This will allow for a variety of events to take place, i.e., live hitting, pitching, and several other drills. These lanes will be rented in the following ways: $25 per 1/2 hour and $40 per hour.
- Private instructions for teams or individuals.The price will be based on the following formula: 1 hr Lane Rental + Instructor fee (e.g., a team rents a single lane for 2 hours for private hitting lessons for 9 players; the formula breaks down this way: $80 lane rental + $50 instructor fee = $130 per team). The instructor fees will be determined by the instructor, but 20% of the instructor fee is retained by Barney’s Bullpen.
- A winter Skills and Drills league for specific age groups.This will consist of a specific hitting objective given to teams in each age group (3 players per team) each week. Points are awarded to individuals for correctly completing an objective. Team and individual scores will be recorded for 6 weeks. At the end of this time, 1st, 2nd, & 3rd place awards will be given to the individuals and teams that obtain the highest total points in their age group. It will cost each team $300 registration fees to participate in the league. A complete set of rules and prizes will be provided at the time the league starts, and the awards to be paid out of the registration fees.
- Video analysis of hitting and pitching (target date 2nd year).With a video camera and motion analysis software a player can have his/her hitting swing or pitching motion record to a CD. The software converts the motion into an animated stick figure which allows players, coaches, and instructors to identify the areas that need improving. At this time, the cost is estimated to be $75 for 1/2 hour.
The building’s open layout allows us to easily customize the arrangement of options for different events. For example, when hosting coaches’ clinics, umpire clinics, team meetings, or league meetings, we can combine open lanes to create larger competitive spaces with room for spectators. Fees for special events will depend on the number of participants and length of the meeting or clinic. In lieu of charging fees for league meetings, advertising space on the league websites can be negotiated.
Market Analysis Summary
The baseball market in our area is large and growing. From peewee leagues to adult softball to serious high school team members, North Dakota residents love baseball. However, outside of organized teams, there are few places where local residents can go to hone their skills, and even fewer facilities for training during the off-season. Barney’s Bullpen will fill this niche.
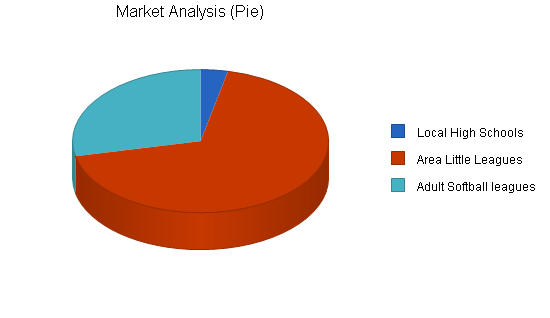
- Our primary focus will be on the amateur baseball and softball leagues for children and high school students in 12 cities. The boundaries will be City A and City B to the north, City C to the east, City D to the south, and City E to the west. There are youth leagues in 9 of the 12 cities, high schools in each, and four colleges with baseball and/or softball programs within the area. There are over 6,000 kids playing baseball/softball in this area. Approximately 1/4 of these kids are playing in competitive leagues, where training and skills matter to the players, the coaches, the parents, and the fans.
- The next largest potential market segment is adult softball leagues. Although this group is sizeable, we do not know how many would be interested in our services, particularly once we acquire a reputation for being “a kids’ place.”
- Finally, while serious high school and collegiate athletes are relatively few compared to the other groups, their competitive drive and search for off-season training should produce high participation.
4.1 Market Segmentation
High School Baseball/Softball Teams:These teams need indoor practice space since their seasons start in late February. Most of the high school programs now start at the beginning of the school year, and most of the players participate in fall leagues that last until the end of October. Practice is limited to school gyms during the winter months.
Youth Leagueswill be the mainstay of this business.
- Recreational Baseball:These players typically start practicing in late April when weather allows them to venture outside. This season usually runs for 5 months.
- Classic Baseball:These players will play games for 8 to 9 months out of the year and most will practice or attend private instruction year-round. 75% to 80% of these players attend weekly hitting and pitching instructions from October to February. A smaller percentage will seek year-round instruction.
- Girls’ Softball:Girls’ softball is similar to the classic leagues in that games are played 8 to 9 months a year. A smaller volume, 25% to 30%, seek off season training.
Adult Softball Leagues:These leagues consist of men, women, and co-ed divisions. These leagues play almost year round combined with tournaments and league play. We expect to draw mostly from the competitive divisions.
Other potential customers are the youth groups at local churches and team building events for area businesses.
Need real milestones? Establish a clear path for your business with real-world examples. Create your own business plan
| Market Analysis | |||||||
| Year 1 | Year 2 | Year 3 | Year 4 | Year 5 | |||
| Potential Customers | Growth | CAGR | |||||
| Local High Schools | 2% | 300 | 306 | 312 | 318 | 324 | 1.94% |
| Area Little Leagues | 5% | 6,000 | 6,300 | 6,615 | 6,946 | 7,293 | 5.00% |
| Adult Softball leagues | 2% | 2,500 | 2,550 | 2,601 | 2,653 | 2,706 | 2.00% |
| Total | 4.07% | 8,800 | 9,156 | 9,528 | 9,917 | 10,323 | 4.07% |
4.2 Target Market Segment Strategy
We will focus on the Classic or Select baseball players and high school players to start. Although we will make a profit with these customers, we will expand our focus to include all areas of baseball and softball as the facility will allow. By focusing on the classic player, we can maximize the advantages of our indoor facility, by catering to their desire to keep up and improve their skills all year. However, the high school and collegiate teams will provide a stable repeat customer base.
4.2.1 Market Needs
Parents are looking to give their children an advantage over other children in organized sports activities. Group coaching is simply not enough to give children the proper skills required to play at an above average level in baseball and softball. Private coaches and skill trainers are fully booked by eager parents looking for one-on-one training for their child. “Select” baseball and softball leagues are increasing in popularity and advanced skills training is an absolute requirement for participants in these activities. This indoor facility will cater to the increasing need for individualized skills training on a year-round basis.
4.3 Service Business Analysis
Barney’s Bullpen is a service oriented business; it also has tendencies of a entertainment business. Some of the customers will be looking for a place to go for an evening’s entertainment or even stress relief, while others will be looking for a facility to train seriously. Players, parents, and coaches have comfort zones that can be difficult to work with at times. One of the challenges for the staff at Barney’s Bullpen is to be alert to the varied needs of the customers.
Leagues need places to conduct meetings during the off season, coaches want access to a variety of facilities at a moment’s notice, and parents want private lessons for their children. Other areas that may need to be evaluated are theme events for church or business groups, dedicated time slots to local professional athletes, or sponsor a tournament.
Because batting cage facilities can host so many different kinds of customers, and fulfill so many different market needs, the most important initial step for many is deciding on a focus and following through with appropriate advertising, hours of operation, and customer service. Having distinct nights or sections of the facility set aside for different age groups or interests will prevent skilled players from getting frustrated waiting for amateurs to finish “playing,” while keeping customers who are just out for fun from feeling condescended to by more serious players or employees.
4.3.1 Competition and Buying Patterns
The current direct competition for this business is an outdoor-only facility in City F that has 6 hitting lanes. The only indoor facility with comparable services is 20 to 40 miles away, depending on what part of the service area customers come from. While competition is limited, we must still work hard at providing convenient hours of operation, quality service, and fair prices to grow the business and encourage repeat customers.
Our location is a key competitive edge – we are located only 1 mile south of the high school and is 1 block off a major intersection, making us easily accessible to high schoolers and parents dropping off or picking up children. In addition, this facility is 2 blocks from 40 acres of vacant land owned by the City. The city officials are investigating the possibility of building a 12 field baseball/softball complex at this location. This would bring thousands of players to the city on a yearly basis for week-long tournaments.
We are, of course, also competing with after-school programs, other athletic events and team activities, and other unrelated entertainment choices. The choice for committed baseball fans and players will be easy, but our challenge is to convince children, their parents, and other local residents that Barney’s Bullpen is the best way they could spend an evening or afternoon. We are more healthy (and more fun) than watching TV or going to a movie; for a large family, we are more affordable than going to a movie or a mini-golf range, since rates are per lane, not per player; we are more convenient than driving to City F.
Our success depends on establishing a loyal repeat clientele who bring their families, friends, colleagues and peers to Barney’s Bullpen. Our website will help get the word out, but monetary sponsorship for the local leagues and word-of-mouth will be more relevant to local residents, who expect local businesses to be involved in community life.
Strategy and Implementation Summary
Although Barney’s Bullpen has a major edge with very little competition in the local area, it will be imperative that we send e-mail notifications to youth league coaches and make personal contact with the high school and college coaches to be successful. Quality of service, availability, and price are keys to meeting the sales forecast.
5.1 Competitive Edge
Barney’s Bullpen will start with a critical competitive edge: there is no competitor we know of within a 20-mile radius of the targeted area that has a facility of our type. The management also has a 9-year relationship with the targeted youth leagues, as well as the high schools and colleges. In addition to these attributes, the management at Barney’s Bullpen has an extreme love of the sport and enjoys teaching baseball skills to all levels.
To develop good business strategies, perform a SWOT analysis of your business. It's easy with our free guide and template.Learn how to perform a SWOT analysis
5.2 Marketing Strategy
Marketing for the Barney’s Bullpen will differ throughout the year, depending upon demand for the facility. During the winter, when weather restricts outdoor activity and leagues are not playing, we will not need to do as much marketing or advertising. However, during late spring and early summer, we will need to make sure we remain in front of our customers.
Startup Marketing:
- E-mail notification to 75+ local classic coaches in the target area. The e-mail database has already been compiled.
- Flyers distributed to the high school and college coaches in the target area.
- Advertisements at local sports businesses and facilities.
- Advertisements in local papers.
- Word-of-mouth.
- Barney’s Bullpen website.
Spring and Summer Marketing:
- Make donations to area youth leagues in the form of registration forms with attached discount coupons. This will in turn have us listed on the website of each league as a league sponsor.
- Spring break and school holiday specials.
- Attend league coaches’ meetings.
- Summer programs: hitting leagues, June – August discounted summer pass, and clinics.
Fall and Winter Marketing:
- Advertise in local papers.
- Word-of-mouth.
- Barney’s Bullpen website.
5.3 Sales Strategy
We will direct our sales efforts and funds to the primary customer base. Coaches, parents, and players will be informed of the facility and services through e-mail and direct contact. Sales efforts during the start-up phase will be direct and beneficial for the customers. Continuous sales efforts will vary depending on the time of year.
Startup Sales Strategy for the first month:
- Monday through Thursday – 2 for 1 batting tokens.
- First 100 customers receive a Barney’s Bullpen shirt.
- A discount coupon received for each utility lane rental.
- Door prizes for weekend customers (i.e., Rangers’ tickets, summer passes, and gift cards)
Sales Strategy:
- Discount membership packages.
- Yearly league donations.
- Spring break and school holiday discounts.
- Trophies for Fall, Winter, Spring, and Summer hitting champions.
- Tournament specials. Discount coupons given to league officials to pass out to teams attending local tournaments.
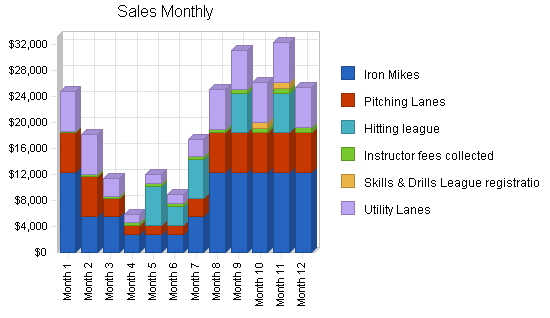
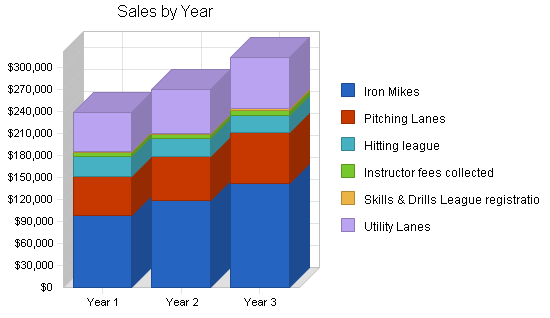
5.3.1 Sales Forecast
We expect sales to peak October through March; the rest of the year will be slower but could be higher than forecasted due to weather conditions for the local area. In 2005 and 2006, we expect 10% to 20% sales growth as we add new services and the customer base grows. We will do sales on credit only for businesses and large groups with whom we want to establish long-term relationships. We are estimating 10% of sales will be on credit.
Our direct Cost of Sales are limited to the fees that we pay to individual Instructors and Skills & Drills League prizes. We keep 20% of instructor fees as a facilities usage fee, and pay the other 80% to our independently-contracted Instructors within the same month that sales are recorded. We estimate that about 50% of the registration fees collected for the Skills & Drills League will be used toward the prizes awarded to the best three contestants.
The operating costs for maintenance, repair, and replacement of equipment as it becomes worn out, broken or lost are reflected in our Profit and Loss table
Need actual charts? We recommend using LivePlan as the easiest way to create graphs for your own business plan. Create your own business plan
Need actual charts? We recommend using LivePlan as the easiest way to create graphs for your own business plan. Create your own business plan
| Sales Forecast | |||
| Year 1 | Year 2 | Year 3 | |
| Sales | |||
| Iron Mikes | $98,226 | $117,871 | $141,445 |
| Pitching Lanes | $52,479 | $60,351 | $69,403 |
| Hitting league | $27,000 | $24,000 | $24,000 |
| Instructor fees collected | $5,900 | $6,200 | $6,500 |
| Skills & Drills League registration fees | $1,800 | $1,500 | $2,100 |
| Utility Lanes | $52,479 | $60,351 | $69,403 |
| Total Sales | $237,884 | $270,273 | $312,852 |
| Direct Cost of Sales | Year 1 | Year 2 | Year 3 |
| Skills & Drills League prizes | $900 | $750 | $1,050 |
| Instructor fees paid | $4,720 | $4,960 | $5,200 |
| Row 3 | $0 | $0 | $0 |
| Subtotal Direct Cost of Sales | $5,620 | $5,710 | $6,250 |
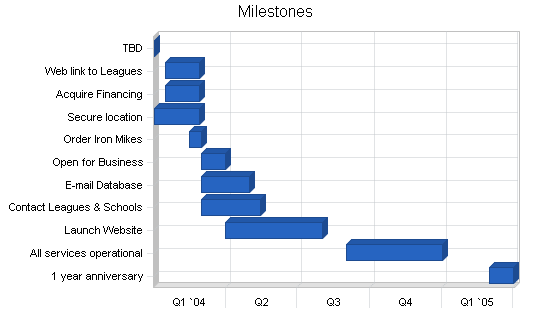
5.4 Milestones
The following milestones are to be used as a roadmap to the success of Barney’s Bullpen. The marketing milestones will be ongoing. While the Internet site will be a useful tool in marketing, it is not critical that it be launched on opening day. The dates given for the Web milestones are optimistic. All other milestones will need to be followed as closely as possible.
Need real milestones? Establish a clear path for your business with real-world examples. Create your own business plan
| Milestones | |||||
| Milestone | Start Date | End Date | Budget | Manager | Department |
| TBD | 1/1/2004 | 1/1/2004 | $0 | TBD | Department |
| Web link to Leagues | 1/15/2004 | 2/28/2004 | $0 | Willis | Web |
| Acquire Financing | 1/15/2004 | 2/28/2004 | $0 | Willis | Management |
| Secure location | 1/1/2004 | 2/28/2004 | $0 | Willis | Management |
| Order Iron Mikes | 2/15/2004 | 3/1/2004 | $0 | Willis | All |
| Open for Business | 3/1/2004 | 4/1/2004 | $0 | Willis | All |
| E-mail Database | 3/1/2004 | 5/1/2004 | $0 | Willis plus Web Admin | Marketing |
| Contact Leagues & Schools | 3/1/2004 | 5/15/2004 | $0 | Willis | Marketing |
| Launch Website | 4/1/2004 | 8/1/2004 | $0 | Web Admin | Web |
| All services operational | 9/1/2004 | 1/1/2005 | $0 | TBD | All |
| 1 year anniversary | 3/1/2005 | 4/1/2005 | $0 | Willis | All |
| Totals | $0 |
Web Plan Summary
In baseball terminology, the scorekeeper records all of the events for each game in the scorebook. Barney’s Bullpen will use the website as our scorebook. Providing information, ranging from hours of operation to upcoming events, to the customer base will be the primary focus. As the website develops, we will provide training tips and possibly interactive training videos.
6.1 Development Requirements
The website will be initially developed with few technical resources. A simple hosting provider, such as Yahoo! Web services, will host the site and provide the technical back end.
The website, logo, and graphics will be developed over a period of the first year. The home page with critical data will be up before the start date. Maintenance of the site will be performed by the Barney’s Bullpen administrator.
Management Summary
Barney’s Bullpen will be a for-profit North Dakota Limited Liabilities Corporation (LLC).
The following is a summary of the management team:
Barney Crouch has 10+ years of management experience in the manufacturing industry. He served the community for four years on the local youth baseball board, and also served a term last year as Vice President of the league. Barney played competitive baseball for 12 years, and coached baseball and basketball teams for six years.
Jen Crouch has spent 14 years with the City of Bismarck in administrative and budgetary roles. She managed a multi-million dollar budget for Agency Q and other city programs, and was elected as league secretary for the local youth baseball board.
7.1 Personnel Plan
The following table is a projection of personnel. The only full-time employee is Barney Crouch; Jen will work part-time as our bookkeeper and fill in as a supervisor when needed. We will hire up to two part-time employees to help with cleaning and cage reset, but at least one of these positions will be largely seasonal. We expect to draw our part-time employees from boys we know on the local high-school baseball team.
Our instructors are independent contractors; their fees are listed as direct cost of sales in the Sales Forecast table.
| Personnel Plan | |||
| Year 1 | Year 2 | Year 3 | |
| Owner | $30,000 | $32,000 | $34,000 |
| Bookkeeper | $12,000 | $14,000 | $14,000 |
| Part time #1 | $7,600 | $7,700 | $7,800 |
| Part time #2 | $6,400 | $7,700 | $7,800 |
| Total People | 4 | 4 | 4 |
| Total Payroll | $56,000 | $61,400 | $63,600 |
Financial Plan
The following section outlines the financial plan for Barney’s Bullpen:
- Start-up funding of $78,000 is required. $36,000 of the start-up is for the purchase of the Iron Mike Pitching equipment and associated netting, control panel, other required equipment. Rent, utilities, and advertising are the only monthly expenses listed in the start-up requirements. Insurance will be an annual expense.
- The start-up capital will be obtained through a combination of investor contributions ($8,000) and an SBA long-term loan ($70,000).
8.1 Important Assumptions
The financial plan depends on important assumptions, most of which are shown in the following table as annual assumptions. The monthly assumptions are included in the appendices. From the beginning, we recognize that repeat business, weather, economic conditions, and growth of youth sports will determine our success. These reasons are why we have chosen a conservative revenue stream.
Two of the more important underlying assumptions are:
- We assume a strong economy, without major recession.
- We assume, of course, that there are no unforeseen changes in the growth of classic baseball participation to make our services immediately obsolete.
| General Assumptions | |||
| Year 1 | Year 2 | Year 3 | |
| Plan Month | 1 | 2 | 3 |
| Current Interest Rate | 8.00% | 8.00% | 8.00% |
| Long-term Interest Rate | 8.00% | 8.00% | 8.00% |
| Tax Rate | 30.00% | 30.00% | 30.00% |
| Other | 0 | 0 | 0 |
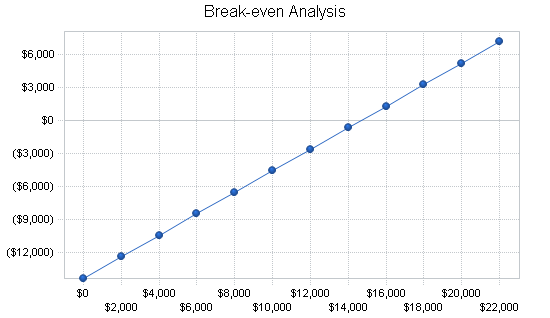
8.2 Break-even Analysis
The following chart and table summarize our break-even analysis. This projection is based on very conservative estimates of revenue.
Need real milestones? We recommend using LivePlan as the easiest way to create milestones for your own business plan. Create your own business plan
| Break-even Analysis | |
| Monthly Revenue Break-even | $14,659 |
| Assumptions: | |
| Average Percent Variable Cost | 2% |
| Estimated Monthly Fixed Cost | $14,313 |
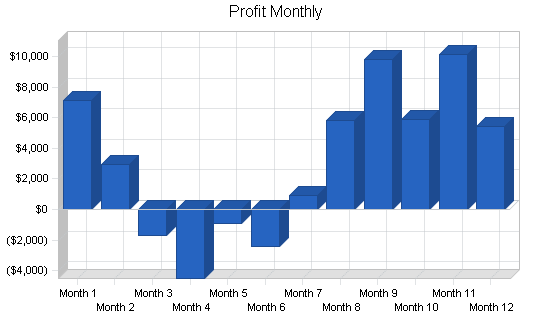
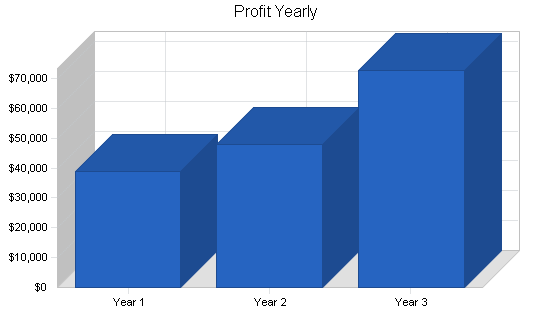
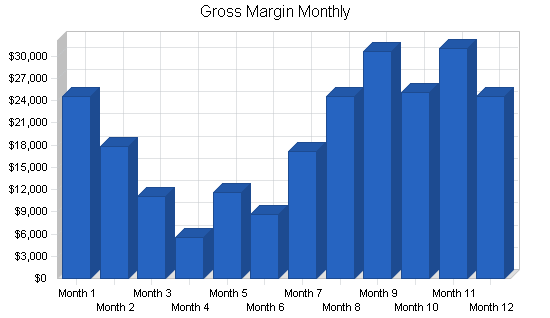
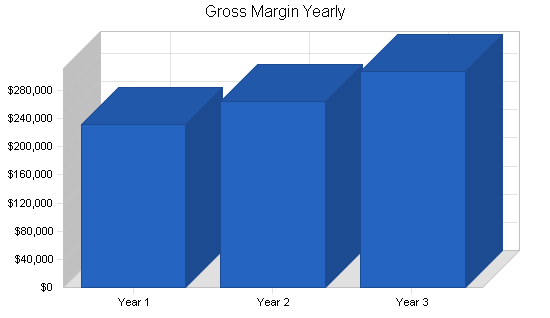
8.3 Projected Profit and Loss
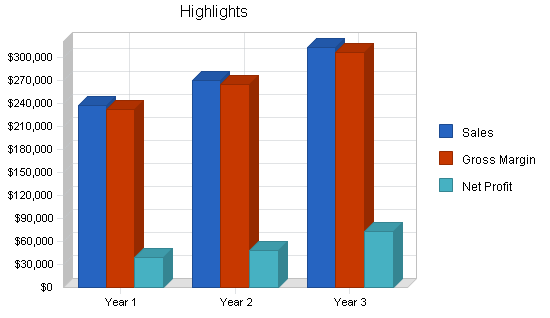
Our projected profit and loss is shown on the following table, with sales increasing from more than $200K the first year to more than $300K the third year. We show a profit in the first year with a relatively low sales forecast.
We are projecting very conservatively. The detailed monthly projections are included in the appendices.
Need impressive charts? Discover the simplest way to create detailed graphs for your business plan. Create your own business plan
Need impressive charts? Discover the simplest way to create detailed graphs for your business plan. Create your own business plan
Need real financials? We recommend using LivePlan as the easiest way to create financials for your own business plan. Create your own business plan
Need actual charts? We recommend using LivePlan as the easiest way to create graphs for your own business plan. Create your own business plan
| Pro Forma Profit and Loss | |||
| Year 1 | Year 2 | Year 3 | |
| Sales | $237,884 | $270,273 | $312,852 |
| Direct Cost of Sales | $5,620 | $5,710 | $6,250 |
| Other Costs of Sales | $0 | $0 | $0 |
| Total Cost of Sales | $5,620 | $5,710 | $6,250 |
| Gross Margin | $232,264 | $264,563 | $306,602 |
| Gross Margin % | 97.64% | 97.89% | 98.00% |
| Expenses | |||
| Payroll | $56,000 | $61,400 | $63,600 |
| Marketing/Promotion | $4,600 | $5,500 | $6,000 |
| Depreciation | $5,143 | $5,143 | $5,143 |
| Rent | $86,004 | $88,000 | $92,000 |
| Utilities | $6,000 | $6,000 | $6,000 |
| Insurance | $0 | $10,000 | $10,000 |
| Payroll Taxes | $0 | $0 | $0 |
| Equipment Repair and Maintenance | $3,034 | $4,225 | $4,858 |
| Ball and bat replacement | $1,050 | $1,811 | $2,082 |
| Other (incl. property taxes) | $9,925 | $10,000 | $10,000 |
| Total Operating Expenses | $171,755 | $192,078 | $199,683 |
| Profit Before Interest and Taxes | $60,509 | $72,485 | $106,919 |
| EBITDA | $65,652 | $77,628 | $112,062 |
| Interest Expense | $5,250 | $4,200 | $3,080 |
| Taxes Incurred | $16,578 | $20,485 | $31,152 |
| Net Profit | $38,681 | $47,799 | $72,687 |
| Net Profit/Sales | 16.26% | 17.69% | 23.23% |
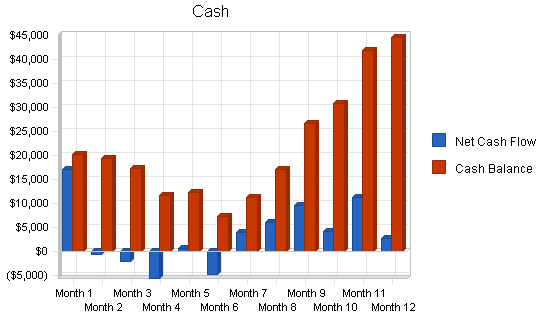
8.4 Projected Cash Flow
The following section shows the cash flow projections for Barney’s Bullpen for the first three years. These include repayment of the principal on a 5-year $70,000 SBA loan in equal monthly payments of $1,167, which we start repaying after the first three months of operations.
Cash flow projections are critical to our success. Our cash balance will reach its minimum in mid-2004, during a low season in the first year of operations. We believe that if we manage our cash wisely during this critical period, the following months’ cash flows should be sufficient to cover all our expenses.
The annual cash flow figures are included here and the more important detailed monthly numbers are included in the appendices.
Need real milestones? Establish a clear path for your business with real-world examples. Create your own business plan
| Pro Forma Cash Flow | |||
| Year 1 | Year 2 | Year 3 | |
| Cash Received | |||
| Cash from Operations | |||
| Cash Sales | $214,096 | $243,246 | $281,567 |
| Cash from Receivables | $18,150 | $26,260 | $30,276 |
| Subtotal Cash from Operations | $232,245 | $269,505 | $311,843 |
| Additional Cash Received | |||
| Sales Tax, VAT, HST/GST Received | $0 | $0 | $0 |
| New Current Borrowing | $0 | $0 | $0 |
| New Other Liabilities (interest-free) | $0 | $0 | $0 |
| New Long-term Liabilities | $0 | $0 | $0 |
| Sales of Other Current Assets | $0 | $0 | $0 |
| Sales of Long-term Assets | $0 | $0 | $0 |
| New Investment Received | $0 | $0 | $0 |
| Subtotal Cash Received | $232,245 | $269,505 | $311,843 |
| Expenditures | Year 1 | Year 2 | Year 3 |
| Expenditures from Operations | |||
| Cash Spending | $56,000 | $61,400 | $63,600 |
| Bill Payments | $124,245 | $156,929 | $170,149 |
| Subtotal Spent on Operations | $180,245 | $218,329 | $233,749 |
| Additional Cash Spent | |||
| Sales Tax, VAT, HST/GST Paid Out | $0 | $0 | $0 |
| Principal Repayment of Current Borrowing | $0 | $0 | $0 |
| Other Liabilities Principal Repayment | $0 | $0 | $0 |
| Long-term Liabilities Principal Repayment | $10,500 | $14,000 | $14,000 |
| Purchase Other Current Assets | $0 | $0 | $0 |
| Purchase Long-term Assets | $0 | $0 | $0 |
| Dividends | $0 | $4,600 | $7,200 |
| Subtotal Cash Spent | $190,745 | $236,929 | $254,949 |
| Net Cash Flow | $41,500 | $32,576 | $56,894 |
| Cash Balance | $44,500 | $77,076 | $133,970 |
8.5 Projected Balance Sheet
The balance sheet in the following table shows conservative growth of net worth, and a sufficiently healthy financial position. The monthly estimates are included in the appendices.
| Pro Forma Balance Sheet | |||
| Year 1 | Year 2 | Year 3 | |
| Assets | |||
| Current Assets | |||
| Cash | $44,500 | $77,076 | $133,970 |
| Accounts Receivable | $5,639 | $6,406 | $7,416 |
| Other Current Assets | $11,150 | $11,150 | $11,150 |
| Total Current Assets | $61,289 | $94,633 | $152,536 |
| Long-term Assets | |||
| Long-term Assets | $36,000 | $36,000 | $36,000 |
| Accumulated Depreciation | $5,143 | $10,286 | $15,429 |
| Total Long-term Assets | $30,857 | $25,714 | $20,571 |
| Total Assets | $92,146 | $120,347 | $173,108 |
| Liabilities and Capital | Year 1 | Year 2 | Year 3 |
| Current Liabilities | |||
| Accounts Payable | $13,815 | $12,816 | $14,089 |
| Current Borrowing | $0 | $0 | $0 |
| Other Current Liabilities | $0 | $0 | $0 |
| Subtotal Current Liabilities | $13,815 | $12,816 | $14,089 |
| Long-term Liabilities | $59,500 | $45,500 | $31,500 |
| Total Liabilities | $73,315 | $58,316 | $45,589 |
| Paid-in Capital | $8,000 | $8,000 | $8,000 |
| Retained Earnings | ($27,850) | $6,231 | $46,831 |
| Earnings | $38,681 | $47,799 | $72,687 |
| Total Capital | $18,831 | $62,031 | $127,518 |
| Total Liabilities and Capital | $92,146 | $120,347 | $173,108 |
| Net Worth | $18,831 | $62,031 | $127,518 |
8.6 Business Ratios
The following table shows the projected businesses ratios along with comparisons for our industry, baseball batting cages (SIC Code 7999.9903). We expect to maintain healthy ratios for profitability, risk, and return.
| Ratio Analysis | ||||
| Year 1 | Year 2 | Year 3 | Industry Profile | |
| Sales Growth | n.a. | 13.62% | 15.75% | 5.73% |
| Percent of Total Assets | ||||
| Accounts Receivable | 6.12% | 5.32% | 4.28% | 7.08% |
| Other Current Assets | 12.10% | 9.26% | 6.44% | 33.26% |
| Total Current Assets | 66.51% | 78.63% | 88.12% | 43.21% |
| Long-term Assets | 33.49% | 21.37% | 11.88% | 56.79% |
| Total Assets | 100.00% | 100.00% | 100.00% | 100.00% |
| Current Liabilities | 14.99% | 10.65% | 8.14% | 21.91% |
| Long-term Liabilities | 64.57% | 37.81% | 18.20% | 28.81% |
| Total Liabilities | 79.56% | 48.46% | 26.34% | 50.72% |
| Net Worth | 20.44% | 51.54% | 73.66% | 49.28% |
| Percent of Sales | ||||
| Sales | 100.00% | 100.00% | 100.00% | 100.00% |
| Gross Margin | 97.64% | 97.89% | 98.00% | 100.00% |
| Selling, General & Administrative Expenses | 63.80% | 76.90% | 76.28% | 76.43% |
| Advertising Expenses | 2.16% | 1.90% | 1.64% | 2.77% |
| Profit Before Interest and Taxes | 25.44% | 26.82% | 34.18% | 1.89% |
| Main Ratios | ||||
| Current | 4.44 | 7.38 | 10.83 | 1.18 |
| Quick | 4.44 | 7.38 | 10.83 | 0.80 |
| Total Debt to Total Assets | 79.56% | 48.46% | 26.34% | 1.76% |
| Pre-tax Return on Net Worth | 293.44% | 110.08% | 81.43% | 61.12% |
| Pre-tax Return on Assets | 59.97% | 56.74% | 59.99% | 4.52% |
| Additional Ratios | Year 1 | Year 2 | Year 3 | |
| Net Profit Margin | 16.26% | 17.69% | 23.23% | n.a |
| Return on Equity | 205.41% | 77.06% | 57.00% | n.a |
| Activity Ratios | ||||
| Accounts Receivable Turnover | 4.22 | 4.22 | 4.22 | n.a |
| Collection Days | 57 | 81 | 81 | n.a |
| Accounts Payable Turnover | 9.99 | 12.17 | 12.17 | n.a |
| Payment Days | 27 | 31 | 29 | n.a |
| Total Asset Turnover | 2.58 | 2.25 | 1.81 | n.a |
| Debt Ratios | ||||
| Debt to Net Worth | 3.89 | 0.94 | 0.36 | n.a |
| Current Liab. to Liab. | 0.19 | 0.22 | 0.31 | n.a |
| Liquidity Ratios | ||||
| Net Working Capital | $47,474 | $81,816 | $138,447 | n.a |
| Interest Coverage | 11.53 | 17.26 | 34.71 | n.a |
| Additional Ratios | ||||
| Assets to Sales | 0.39 | 0.45 | 0.55 | n.a |
| Current Debt/Total Assets | 15% | 11% | 8% | n.a |
| Acid Test | 4.03 | 6.88 | 10.30 | n.a |
| Sales/Net Worth | 12.63 | 4.36 | 2.45 | n.a |
| Dividend Payout | 0.00 | 0.10 | 0.10 | n.a |
Appendix
| Sales Forecast | |||||||||||||
| Month 1 | Month 2 | Month 3 | Month 4 | Month 5 | Month 6 | Month 7 | Month 8 | Month 9 | Month 10 | Month 11 | Month 12 | ||
| Sales | |||||||||||||
| Iron Mikes | 0% | $12,240 | $5,508 | $5,508 | $2,754 | $2,754 | $2,754 | $5,508 | $12,240 | $12,240 | $12,240 | $12,240 | $12,240 |
| Pitching Lanes | 0% | $6,120 | $6,120 | $2,754 | $1,377 | $1,377 | $1,377 | $2,754 | $6,120 | $6,120 | $6,120 | $6,120 | $6,120 |
| Hitting league | 0% | $0 | $0 | $0 | $0 | $6,000 | $3,000 | $6,000 | $0 | $6,000 | $0 | $6,000 | $0 |
| Instructor fees collected | 0% | $200 | $300 | $400 | $400 | $400 | $400 | $400 | $500 | $600 | $700 | $800 | $800 |
| Skills & Drills League registration fees | 0% | $0 | $0 | $0 | $0 | $0 | $0 | $0 | $0 | $0 | $900 | $900 | $0 |
| Utility Lanes | 0% | $6,120 | $6,120 | $2,754 | $1,377 | $1,377 | $1,377 | $2,754 | $6,120 | $6,120 | $6,120 | $6,120 | $6,120 |
| Total Sales | $24,680 | $18,048 | $11,416 | $5,908 | $11,908 | $8,908 | $17,416 | $24,980 | $31,080 | $26,080 | $32,180 | $25,280 | |
| Direct Cost of Sales | Month 1 | Month 2 | Month 3 | Month 4 | Month 5 | Month 6 | Month 7 | Month 8 | Month 9 | Month 10 | Month 11 | Month 12 | |
| Skills & Drills League prizes | $0 | $0 | $0 | $0 | $0 | $0 | $0 | $0 | $0 | $450 | $450 | $0 | |
| Instructor fees paid | 80% | $160 | $240 | $320 | $320 | $320 | $320 | $320 | $400 | $480 | $560 | $640 | $640 |
| Row 3 | $0 | $0 | $0 | $0 | $0 | $0 | $0 | $0 | $0 | $0 | $0 | $0 | |
| Subtotal Direct Cost of Sales | $160 | $240 | $320 | $320 | $320 | $320 | $320 | $400 | $480 | $1,010 | $1,090 | $640 |
| Personnel Plan | |||||||||||||
| Month 1 | Month 2 | Month 3 | Month 4 | Month 5 | Month 6 | Month 7 | Month 8 | Month 9 | Month 10 | Month 11 | Month 12 | ||
| Owner | 0% | $2,500 | $2,500 | $2,500 | $2,500 | $2,500 | $2,500 | $2,500 | $2,500 | $2,500 | $2,500 | $2,500 | $2,500 |
| Bookkeeper | 0% | $1,000 | $1,000 | $1,000 | $1,000 | $1,000 | $1,000 | $1,000 | $1,000 | $1,000 | $1,000 | $1,000 | $1,000 |
| Part time #1 | 0% | $600 | $600 | $700 | $400 | $400 | $400 | $600 | $700 | $800 | $800 | $800 | $800 |
| Part time #2 | 0% | $600 | $600 | $700 | $0 | $0 | $0 | $600 | $700 | $800 | $800 | $800 | $800 |
| Total People | 4 | 4 | 4 | 3 | 3 | 3 | 4 | 4 | 4 | 4 | 4 | 4 | |
| Total Payroll | $4,700 | $4,700 | $4,900 | $3,900 | $3,900 | $3,900 | $4,700 | $4,900 | $5,100 | $5,100 | $5,100 | $5,100 |
| General Assumptions | |||||||||||||
| Month 1 | Month 2 | Month 3 | Month 4 | Month 5 | Month 6 | Month 7 | Month 8 | Month 9 | Month 10 | Month 11 | Month 12 | ||
| Plan Month | 1 | 2 | 3 | 4 | 5 | 6 | 7 | 8 | 9 | 10 | 11 | 12 | |
| Current Interest Rate | 8.00% | 8.00% | 8.00% | 8.00% | 8.00% | 8.00% | 8.00% | 8.00% | 8.00% | 8.00% | 8.00% | 8.00% | |
| Long-term Interest Rate | 8.00% | 8.00% | 8.00% | 8.00% | 8.00% | 8.00% | 8.00% | 8.00% | 8.00% | 8.00% | 8.00% | 8.00% | |
| Tax Rate | 30.00% | 30.00% | 30.00% | 30.00% | 30.00% | 30.00% | 30.00% | 30.00% | 30.00% | 30.00% | 30.00% | 30.00% | |
| Other | 0 | 0 | 0 | 0 | 0 | 0 | 0 | 0 | 0 | 0 | 0 | 0 |
| Pro Forma Profit and Loss | |||||||||||||
| Month 1 | Month 2 | Month 3 | Month 4 | Month 5 | Month 6 | Month 7 | Month 8 | Month 9 | Month 10 | Month 11 | Month 12 | ||
| Sales | $24,680 | $18,048 | $11,416 | $5,908 | $11,908 | $8,908 | $17,416 | $24,980 | $31,080 | $26,080 | $32,180 | $25,280 | |
| Direct Cost of Sales | $160 | $240 | $320 | $320 | $320 | $320 | $320 | $400 | $480 | $1,010 | $1,090 | $640 | |
| Other Costs of Sales | $0 | $0 | $0 | $0 | $0 | $0 | $0 | $0 | $0 | $0 | $0 | $0 | |
| Total Cost of Sales | $160 | $240 | $320 | $320 | $320 | $320 | $320 | $400 | $480 | $1,010 | $1,090 | $640 | |
| Gross Margin | $24,520 | $17,808 | $11,096 | $5,588 | $11,588 | $8,588 | $17,096 | $24,580 | $30,600 | $25,070 | $31,090 | $24,640 | |
| Gross Margin % | 99.35% | 98.67% | 97.20% | 94.58% | 97.31% | 96.41% | 98.16% | 98.40% | 98.46% | 96.13% | 96.61% | 97.47% | |
| Expenses | |||||||||||||
| Payroll | $4,700 | $4,700 | $4,900 | $3,900 | $3,900 | $3,900 | $4,700 | $4,900 | $5,100 | $5,100 | $5,100 | $5,100 | |
| Marketing/Promotion | $1,200 | $500 | $500 | $100 | $750 | $100 | $100 | $100 | $250 | $250 | $250 | $500 | |
| Depreciation | $429 | $429 | $429 | $429 | $429 | $429 | $429 | $429 | $429 | $429 | $429 | $429 | |
| Rent | $5,734 | $5,734 | $5,734 | $5,734 | $5,734 | $5,734 | $8,600 | $8,600 | $8,600 | $8,600 | $8,600 | $8,600 | |
| Utilities | $500 | $500 | $500 | $500 | $500 | $500 | $500 | $500 | $500 | $500 | $500 | $500 | |
| Insurance | $0 | $0 | $0 | $0 | $0 | $0 | $0 | $0 | $0 | $0 | $0 | $0 | |
| Payroll Taxes | 15% | $0 | $0 | $0 | $0 | $0 | $0 | $0 | $0 | $0 | $0 | $0 | $0 |
| Equipment Repair and Maintenance | $306 | $306 | $138 | $69 | $295 | $69 | $138 | $306 | $306 | $367 | $367 | $367 | |
| Ball and bat replacement | 15% | $122 | $122 | $55 | $28 | $28 | $28 | $55 | $122 | $122 | $122 | $122 | $122 |
| Other (incl. property taxes) | $850 | $825 | $825 | $825 | $825 | $825 | $825 | $825 | $825 | $825 | $825 | $825 | |
| Total Operating Expenses | $13,841 | $13,116 | $13,080 | $11,584 | $12,460 | $11,584 | $15,346 | $15,782 | $16,132 | $16,193 | $16,193 | $16,443 | |
| Profit Before Interest and Taxes | $10,679 | $4,692 | ($1,984) | ($5,996) | ($872) | ($2,996) | $1,750 | $8,798 | $14,468 | $8,877 | $14,897 | $8,197 | |
| EBITDA | $11,108 | $5,121 | ($1,556) | ($5,567) | ($444) | ($2,567) | $2,178 | $9,227 | $14,897 | $9,305 | $15,325 | $8,625 | |
| Interest Expense | $467 | $467 | $467 | $459 | $451 | $443 | $436 | $428 | $420 | $412 | $404 | $397 | |
| Taxes Incurred | $3,064 | $1,268 | ($735) | ($1,936) | ($397) | ($1,032) | $394 | $2,511 | $4,214 | $2,539 | $4,348 | $2,340 | |
| Net Profit | $7,149 | $2,958 | ($1,716) | ($4,518) | ($926) | ($2,408) | $920 | $5,859 | $9,834 | $5,925 | $10,145 | $5,460 | |
| Net Profit/Sales | 28.97% | 16.39% | -15.03% | -76.48% | -7.78% | -27.03% | 5.28% | 23.46% | 31.64% | 22.72% | 31.52% | 21.60% |
| Pro Forma Cash Flow | |||||||||||||
| Month 1 | Month 2 | Month 3 | Month 4 | Month 5 | Month 6 | Month 7 | Month 8 | Month 9 | Month 10 | Month 11 | Month 12 | ||
| Cash Received | |||||||||||||
| Cash from Operations | |||||||||||||
| Cash Sales | $22,212 | $16,243 | $10,274 | $5,317 | $10,717 | $8,017 | $15,674 | $22,482 | $27,972 | $23,472 | $28,962 | $22,752 | |
| Cash from Receivables | $0 | $82 | $2,446 | $1,783 | $1,123 | $611 | $1,181 | $919 | $1,767 | $2,518 | $3,091 | $2,628 | |
| Subtotal Cash from Operations | $22,212 | $16,325 | $12,720 | $7,100 | $11,840 | $8,628 | $16,855 | $23,401 | $29,739 | $25,990 | $32,053 | $25,380 | |
| Additional Cash Received | |||||||||||||
| Sales Tax, VAT, HST/GST Received | 0.00% | $0 | $0 | $0 | $0 | $0 | $0 | $0 | $0 | $0 | $0 | $0 | $0 |
| New Current Borrowing | $0 | $0 | $0 | $0 | $0 | $0 | $0 | $0 | $0 | $0 | $0 | $0 | |
| New Other Liabilities (interest-free) | $0 | $0 | $0 | $0 | $0 | $0 | $0 | $0 | $0 | $0 | $0 | $0 | |
| New Long-term Liabilities | $0 | $0 | $0 | $0 | $0 | $0 | $0 | $0 | $0 | $0 | $0 | $0 | |
| Sales of Other Current Assets | $0 | $0 | $0 | $0 | $0 | $0 | $0 | $0 | $0 | $0 | $0 | $0 | |
| Sales of Long-term Assets | $0 | $0 | $0 | $0 | $0 | $0 | $0 | $0 | $0 | $0 | $0 | $0 | |
| New Investment Received | $0 | $0 | $0 | $0 | $0 | $0 | $0 | $0 | $0 | $0 | $0 | $0 | |
| Subtotal Cash Received | $22,212 | $16,325 | $12,720 | $7,100 | $11,840 | $8,628 | $16,855 | $23,401 | $29,739 | $25,990 | $32,053 | $25,380 | |
| Expenditures | Month 1 | Month 2 | Month 3 | Month 4 | Month 5 | Month 6 | Month 7 | Month 8 | Month 9 | Month 10 | Month 11 | Month 12 | |
| Expenditures from Operations | |||||||||||||
| Cash Spending | $4,700 | $4,700 | $4,900 | $3,900 | $3,900 | $3,900 | $4,700 | $4,900 | $5,100 | $5,100 | $5,100 | $5,100 | |
| Bill Payments | $413 | $12,321 | $9,890 | $7,746 | $6,178 | $8,455 | $7,133 | $11,448 | $13,856 | $15,681 | $14,689 | $16,433 | |
| Subtotal Spent on Operations | $5,113 | $17,021 | $14,790 | $11,646 | $10,078 | $12,355 | $11,833 | $16,348 | $18,956 | $20,781 | $19,789 | $21,533 | |
| Additional Cash Spent | |||||||||||||
| Sales Tax, VAT, HST/GST Paid Out | $0 | $0 | $0 | $0 | $0 | $0 | $0 | $0 | $0 | $0 | $0 | $0 | |
| Principal Repayment of Current Borrowing | $0 | $0 | $0 | $0 | $0 | $0 | $0 | $0 | $0 | $0 | $0 | $0 | |
| Other Liabilities Principal Repayment | $0 | $0 | $0 | $0 | $0 | $0 | $0 | $0 | $0 | $0 | $0 | $0 | |
| Long-term Liabilities Principal Repayment | $0 | $0 | $0 | $1,167 | $1,167 | $1,167 | $1,167 | $1,167 | $1,167 | $1,167 | $1,167 | $1,167 | |
| Purchase Other Current Assets | $0 | $0 | $0 | $0 | $0 | $0 | $0 | $0 | $0 | $0 | $0 | $0 | |
| Purchase Long-term Assets | $0 | $0 | $0 | $0 | $0 | $0 | $0 | $0 | $0 | $0 | $0 | $0 | |
| Dividends | $0 | $0 | $0 | $0 | $0 | $0 | $0 | $0 | $0 | $0 | $0 | $0 | |
| Subtotal Cash Spent | $5,113 | $17,021 | $14,790 | $12,813 | $11,245 | $13,522 | $13,000 | $17,515 | $20,123 | $21,948 | $20,956 | $22,700 | |
| Net Cash Flow | $17,099 | ($696) | ($2,069) | ($5,713) | $596 | ($4,894) | $3,856 | $5,886 | $9,616 | $4,042 | $11,098 | $2,681 | |
| Cash Balance | $20,099 | $19,403 | $17,333 | $11,620 | $12,216 | $7,322 | $11,178 | $17,064 | $26,679 | $30,722 | $41,820 | $44,500 |
| Pro Forma Balance Sheet | |||||||||||||
| Month 1 | Month 2 | Month 3 | Month 4 | Month 5 | Month 6 | Month 7 | Month 8 | Month 9 | Month 10 | Month 11 | Month 12 | ||
| Assets | Starting Balances | ||||||||||||
| Current Assets | |||||||||||||
| Cash | $3,000 | $20,099 | $19,403 | $17,333 | $11,620 | $12,216 | $7,322 | $11,178 | $17,064 | $26,679 | $30,722 | $41,820 | $44,500 |
| Accounts Receivable | $0 | $2,468 | $4,191 | $2,886 | $1,694 | $1,762 | $2,042 | $2,603 | $4,182 | $5,523 | $5,612 | $5,739 | $5,639 |
| Other Current Assets | $11,150 | $11,150 | $11,150 | $11,150 | $11,150 | $11,150 | $11,150 | $11,150 | $11,150 | $11,150 | $11,150 | $11,150 | $11,150 |
| Total Current Assets | $14,150 | $33,717 | $34,743 | $31,369 | $24,464 | $25,128 | $20,514 | $24,930 | $32,395 | $43,352 | $47,484 | $58,709 | $61,289 |
| Long-term Assets | |||||||||||||
| Long-term Assets | $36,000 | $36,000 | $36,000 | $36,000 | $36,000 | $36,000 | $36,000 | $36,000 | $36,000 | $36,000 | $36,000 | $36,000 | $36,000 |
| Accumulated Depreciation | $0 | $429 | $857 | $1,286 | $1,714 | $2,143 | $2,571 | $3,000 | $3,429 | $3,857 | $4,286 | $4,714 | $5,143 |
| Total Long-term Assets | $36,000 | $35,571 | $35,143 | $34,714 | $34,286 | $33,857 | $33,429 | $33,000 | $32,571 | $32,143 | $31,714 | $31,286 | $30,857 |
| Total Assets | $50,150 | $69,288 | $69,886 | $66,084 | $58,750 | $58,985 | $53,943 | $57,930 | $64,967 | $75,495 | $79,198 | $89,994 | $92,146 |
| Liabilities and Capital | Month 1 | Month 2 | Month 3 | Month 4 | Month 5 | Month 6 | Month 7 | Month 8 | Month 9 | Month 10 | Month 11 | Month 12 | |
| Current Liabilities | |||||||||||||
| Accounts Payable | $0 | $11,989 | $9,630 | $7,543 | $5,895 | $8,222 | $6,754 | $10,989 | $13,333 | $15,194 | $14,139 | $15,957 | $13,815 |
| Current Borrowing | $0 | $0 | $0 | $0 | $0 | $0 | $0 | $0 | $0 | $0 | $0 | $0 | $0 |
| Other Current Liabilities | $0 | $0 | $0 | $0 | $0 | $0 | $0 | $0 | $0 | $0 | $0 | $0 | $0 |
| Subtotal Current Liabilities | $0 | $11,989 | $9,630 | $7,543 | $5,895 | $8,222 | $6,754 | $10,989 | $13,333 | $15,194 | $14,139 | $15,957 | $13,815 |
| Long-term Liabilities | $70,000 | $70,000 | $70,000 | $70,000 | $68,833 | $67,667 | $66,500 | $65,333 | $64,167 | $63,000 | $61,833 | $60,667 | $59,500 |
| Total Liabilities | $70,000 | $81,989 | $79,630 | $77,543 | $74,728 | $75,889 | $73,254 | $76,322 | $77,499 | $78,194 | $75,972 | $76,623 | $73,315 |
| Paid-in Capital | $8,000 | $8,000 | $8,000 | $8,000 | $8,000 | $8,000 | $8,000 | $8,000 | $8,000 | $8,000 | $8,000 | $8,000 | $8,000 |
| Retained Earnings | ($27,850) | ($27,850) | ($27,850) | ($27,850) | ($27,850) | ($27,850) | ($27,850) | ($27,850) | ($27,850) | ($27,850) | ($27,850) | ($27,850) | ($27,850) |
| Earnings | $0 | $7,149 | $10,106 | $8,391 | $3,872 | $2,946 | $539 | $1,458 | $7,318 | $17,151 | $23,076 | $33,221 | $38,681 |
| Total Capital | ($19,850) | ($12,701) | ($9,744) | ($11,459) | ($15,978) | ($16,904) | ($19,311) | ($18,392) | ($12,532) | ($2,699) | $3,226 | $13,371 | $18,831 |
| Total Liabilities and Capital | $50,150 | $69,288 | $69,886 | $66,084 | $58,750 | $58,985 | $53,943 | $57,930 | $64,967 | $75,495 | $79,198 | $89,994 | $92,146 |
| Net Worth | ($19,850) | ($12,701) | ($9,744) | ($11,459) | ($15,978) | ($16,904) | ($19,311) | ($18,392) | ($12,532) | ($2,699) | $3,226 | $13,371 | $18,831 |