Nightclub Resort Complex Business Plan
EbonySun
Executive Summary
The EbonySun entertainment resort will be one of the world’s largest night life entertainment facilities, located in the Gotham/Metropolis area. The owner, Mr. Clubb, has successfully opened and run 12 different Gotham nightclubs, casinos, and resorts. He will use his experience to launch the next all-in-one party place. EbonySun will have 400,000 square feet to entertain people in a unique way by providing 10 unique themes of nightclub rooms, with a capacity to handle 10,000 to 17,000 people in any given night. The goal is to provide a unique nightlife experience for all adults aged 21-40 living in the Gotham/Metropolis area. The facility will have 4 restaurants with different themes, 10 themed nightclub rooms, 10 individual offices, training and conference rooms, 2 VIP rooms and a large sports center complex for entertaining all kinds of people from nearby businesses and colleges in this area.
The entertainment facility will include a unique outside beach pool with mountains and waterfalls for conducting summer parties. The resort will provide parking facility for 50,000 people including 4 helicopter landing pads to accommodate high profile business executive travelers. This unique entertainment facility is located close to 150 universities and colleges which make it more attractive for college students market.
The EbonySun Entertainment Resort will conduct live concerts, and the different themed club rooms will have entertainments like South America’s wildest party, world’s largest dance floors, water bars, hot tub bars, Oxygen bars, New Orleans entertainment theme, 60’s & 70’s music entertainment, rooms with galaxy themes, country dance central, hip-hop and rock dance floors, Broadway themes, etc. The Sports Center has 100 TV terminals showing various world sports events and will also have over 200 gaming machines.
The goal is to provide a unique nightlife entertainment resort unlike any that exists anywhere in the U.S. at this time. With its unique themes and facilities, the EbonySun Entertainment Resort will be able to attract and serve 8 million people in the larger Gotham/Metropolis area.
To fund construction of the facility, and support its cash reserves during the first year, we are seeking $7.96 Million in equity financing. In addition to an equity stake in the company, investors will receive dividends up to three times their initial investment starting in the third year. This entertainment resort business plan has been developed to facilitate the startup of this venture, seek investment and assist the management team in running the company. Details of the investment offering can be found in the financial topics.
Objectives
The BigBank Corp management has identified a need of a unique Nightlife entertainment Resort in Gotham/Metropolis area in Gotham. With its proximity to hundreds of colleges, the resort will generate good revenues through entertainment. Th objective of EbonySun project is to create an ultimate nightclub entertainment resort with multi national themes along with sports and dining facilities to create a unique night entertainment specially for college students and business executives in Gotham.
- Become a leader in Nightlife Entertainment. Create one of a kind facility with 10 different themes, live concerts, multi-lever bars, various national theme rooms, huge dance floors, VIP luxury entertainment rooms etc
- Capitalize on excellent location opportunity where there is no competitors exist at such large scale setup
- Maintain tight control of costs, operations and cash flow through diligent management
- Provide unique customer experience and create satisfied customers
Mission
EbonySun Entertainment Resort provides an unmatchable, unique exiting experience for Nightlife entertainment. We provide highest quality entertainment in wide range of theme based nightclub rooms.!--StartFragment --> Provide facility for wildest party and dance events. Provide high quality and wide variety food facilities for people. Provide highest quality customer service through highly trained staff. Our goal is to be a step ahead of the competition. We want our customers to have more fun during their leisure time. Provide unique multinational food facilities in world class theme based nightlife entertainment centers. We want to be the leader in nightlife entertainment in U.S.
Keys to Success
The keys to success in achieving our goals are:
- Highest quality service.
- Managing finances to increase profit by reducing operating costs.
- !--StartFragment -->!--StartFragment -->Experienced management.
- Creating a unique entertainment effect. Increasing the number of repeated customers.
- !--StartFragment -->Targeted Marketing through various advertising channels. Barriers to entry due to uniqueness of facility.
- !--StartFragment -->Securing financing
- !--StartFragment -->Maintaining and growing its referral networks to generate new and repeat sales.
- !--StartFragment -->Improving efficiencies of operations.
- Price competitive service offerings
Need real financials? We recommend using LivePlan as the easiest way to create financials for your own business plan. Create your own business plan

Company Summary
EbonySun Entertainment Resort is owned and operated by BigBank Corporation. The resort is funded through equity financing. The resort will be managed by professional management team to increase sales revenue and improve the rate of return from investment. The company is seeking $7.96 Million initial equity financing for building the facility. With its innovative business idea and unique location, the resort will be able to generate good revenues and rate of returns for its investors.
This unique entertainment facility is located close to 150 universities and colleges, which makes it more attractive for the college students market.
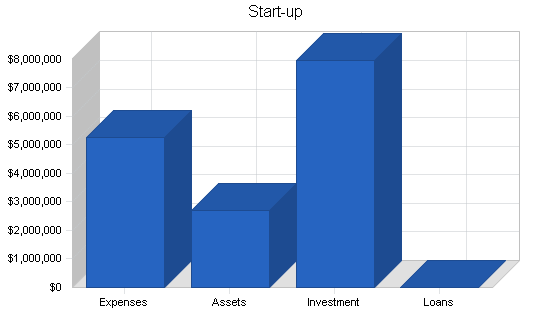
Start-up Summary
The parent company BigBank Corporation is currently seeking $7.96 million of equity financing to finance the new entertainment resort facility. Most of the expenses will be used for constructing the resort facility in Gotham/Gotham Metropolis area.
Long-term assets include the EbonySun resort structure, at 400,000 square feet of currently undeveloped real estate, and heavy duty equipment such as refrigeration units, kitchen equipment, and the like. Other Current Assets includes furniture and fixtures for every bar, restaurant, and dance hall in the structure. Lighting will be particularly elaborate, to create the different “moods” of each area.
Need real financials? Explore a spreadsheet-free path to generating financial data for your business. Create your own business plan
| Start-up | |
| Requirements | |
| Start-up Expenses | |
| Resort Construction Expenses | $500,000 |
| Audio/Ligting Lease Payment | $150,000 |
| Air Condition Upgrade | $500,000 |
| Bar Equipment | $475,000 |
| Bar Supply | $500,000 |
| Entertainment Artist Fees | $300,000 |
| Cash Reserves | $250,000 |
| Exterior Signage | $400,000 |
| Fees & Permits | $100,000 |
| FFE | $110,000 |
| Impact Fees | $40,000 |
| Initial Marketing | $100,000 |
| Kitchen Upgrade | $252,500 |
| Interior Refit | $800,000 |
| Legal | $100,000 |
| Opening Salaries Deposit | $490,000 |
| Paper Products | $60,000 |
| Point of Sale Systems | $122,500 |
| Other | $0 |
| Total Start-up Expenses | $5,250,000 |
| Start-up Assets | |
| Cash Required | $500,000 |
| Start-up Inventory | $10,000 |
| Other Current Assets | $200,000 |
| Long-term Assets | $2,000,000 |
| Total Assets | $2,710,000 |
| Total Requirements | $7,960,000 |
Company Ownership
The company will be jointly owned by its founder and outside investors. The founder, Mr. Clubb, has over 30 years of experience in the entertainment, resort, nightclub, and casino industries. Mr. Clubb will retain 40% ownership of the venture and serve as the General Manager for the first three years. He is offering 60% equity ownership for the remaining $5.96 Million of investment necessary to start this project. Every $99,333 of investment will buy 1% equity ownership. Ideally, 2 investors would make up the bulk of the funding. They will start receiving dividends in the third year, and would be eligible in the fifth year to opt for a buy-out option of their shares by Mr. Clubb.

Services
The entertainment resort will have the following amenities:
- 10 individually-themed nightclub rooms for people with different tastes.
- 2 VIP Luxury rooms.
- 4 Restaurants seating 300 and a midnight cafe.
- 1 Sports Central Game room with over 100 TVs with various world sporting events and over 200 Gaming devices for customer entertainment.
- 15 rooms for entertainment, which cannot be matched.
- Outside beach pool with mountains and waterfalls for conducting summer parties.
- Parking for 50,000 people including 4 helicopter landing pads to accommodate high-profile business executive travelers.
Market Analysis Summary
The EbonySun Entertainment Resort has a wide variety of young people as their target market. The unique facility with dance and music along with bars and restaurants will attract young people living in the local area along with visiting tourists. The Metropolis area which has over 150 colleges and universities in the nearby area. These higher number of colleges makes it very easy to reach its students market through targeted advertising. The proximity of this area to these universities increases the success rate of this project.
Market Analysis
The EbonySun Entertainment Resort is located in the Metropolis area of Gotham, which has over 150 colleges and universities in the nearby area. These higher number of colleges makes it very easy to reach its students market through targeted advertising. The proximity of this area to these universities increases the success rate of this project.
The following data shows the high sales revenue involved with sales of alcoholic beverages in United States. This data shows high probability of success of EbonySun Entertainment Resort. Data is based on the 2002 Economic Census, and includes Sector 71 : Arts, Entertainment, and Recreation, and 39202 : Sales of alcoholic beverages.
Related Industries by Product Line
NAICS code
Industry description
Number of establishments
Sales, receipts, or revenue
($1,000)
7111
Performing arts companies
674
76,252
71111
Theater companies and dinner theaters
557
54,073
711110
Theater companies and dinner theaters
557
54,073
71112
Dance companies
6
1,550
711120
Dance companies
6
1,550
71113
Musical groups and artists
78
15,604
711130
Musical groups and artists
78
15,604
71119
Other performing arts companies
33
5,025
711190
Other performing arts companies
33
5,025
7112
Spectator sports
492
88,348
71121
Spectator sports
492
88,348
711211
Sports teams and clubs
166
25,150
711212
Race tracks
287
62,401
711219
Other spectator sports
39
797
7113
Promoters of performing arts, sports, and similar events
858
169,214
71131
Promoters of performing arts, sports, and similar events with facilities
524
146,696
711310
Promoters of performing arts, sports, and similar events with facilities
524
146,696
71132
Promoters of performing arts, sports, and similar events without facilities
334
22,518
711320
Promoters of performing arts, sports, and similar events without facilities
334
22,518
7114
Agents and managers for artists, athletes, entertainers and other public figures
7
210
71141
Agents and managers for artists, athletes, entertainers and other public figures
7
210
711410
Agents and managers for artists, athletes, entertainers and other public figures
7
210
7115
Independent artists, writers, and performers
47
11,107
71151
Independent artists, writers, and performers
47
11,107
711510
Independent artists, writers, and performers
47
11,107
712
Museums, historical sites, and similar institutions
347
17,000
7121
Museums, historical sites, and similar institutions
347
17,000
71211
Museums
253
10,987
712110
Museums
253
10,987
71212
Historical sites
35
2,832
712120
Historical sites
35
2,832
71213
Zoos and botanical gardens
51
3,104
712130
Zoos and botanical gardens
51
3,104
71219
Nature parks and other similar institutions
8
77
712190
Nature parks and other similar institutions
8
77
713
Amusement, gambling, and recreation industries
18,483
2,386,699
7131
Amusement parks and arcades
214
72,261
71311
Amusement and theme parks
128
54,839
713110
Amusement and theme parks
128
54,839
71312
Amusement arcades
86
17,422
713120
Amusement arcades
86
17,422
7132
Gambling industries
815
276,717
71321
Casino (except casino hotels)
304
201,901
713210
Casinos (except casino hotels)
304
201,901
71329
Other gambling industries
511
74,816
713290
Other gambling industries
511
74,816
7139
Other amusement and recreation services
17,454
2,037,721
71391
Golf courses and country clubs
8,764
1,004,660
713910
Golf courses and country clubs
8,764
1,004,660
71392
Skiing facilities
247
30,226
713920
Skiing facilities
247
30,226
71393
Marinas
1,066
68,830
713930
Marinas
1,066
68,830
71394
Fitness and recreational sports centers
1,139
86,527
713940
Fitness and recreational sports centers
1,139
86,527
71395
Bowling centers
3,815
471,739
713950
Bowling centers
3,815
471,739
71399
All other amusement and recreation industries
2,423
375,739
713990
All other amusement and recreation industries
2,423
375,739
|
NAICS code |
Industry description |
Number of establishments |
Sales, receipts, or revenue |
|
7111 |
Performing arts companies |
674 |
76,252 |
|
71111 |
Theater companies and dinner theaters |
557 |
54,073 |
|
711110 |
Theater companies and dinner theaters |
557 |
54,073 |
|
71112 |
Dance companies |
6 |
1,550 |
|
711120 |
Dance companies |
6 |
1,550 |
|
71113 |
Musical groups and artists |
78 |
15,604 |
|
711130 |
Musical groups and artists |
78 |
15,604 |
|
71119 |
Other performing arts companies |
33 |
5,025 |
|
711190 |
Other performing arts companies |
33 |
5,025 |
|
7112 |
Spectator sports |
492 |
88,348 |
|
71121 |
Spectator sports |
492 |
88,348 |
|
711211 |
Sports teams and clubs |
166 |
25,150 |
|
711212 |
Race tracks |
287 |
62,401 |
|
711219 |
Other spectator sports |
39 |
797 |
|
7113 |
Promoters of performing arts, sports, and similar events |
858 |
169,214 |
|
71131 |
Promoters of performing arts, sports, and similar events with facilities |
524 |
146,696 |
|
711310 |
Promoters of performing arts, sports, and similar events with facilities |
524 |
146,696 |
|
71132 |
Promoters of performing arts, sports, and similar events without facilities |
334 |
22,518 |
|
711320 |
Promoters of performing arts, sports, and similar events without facilities |
334 |
22,518 |
|
7114 |
Agents and managers for artists, athletes, entertainers and other public figures |
7 |
210 |
|
71141 |
Agents and managers for artists, athletes, entertainers and other public figures |
7 |
210 |
|
711410 |
Agents and managers for artists, athletes, entertainers and other public figures |
7 |
210 |
|
7115 |
Independent artists, writers, and performers |
47 |
11,107 |
|
71151 |
Independent artists, writers, and performers |
47 |
11,107 |
|
711510 |
Independent artists, writers, and performers |
47 |
11,107 |
|
712 |
Museums, historical sites, and similar institutions |
347 |
17,000 |
|
7121 |
Museums, historical sites, and similar institutions |
347 |
17,000 |
|
71211 |
Museums |
253 |
10,987 |
|
712110 |
Museums |
253 |
10,987 |
|
71212 |
Historical sites |
35 |
2,832 |
|
712120 |
Historical sites |
35 |
2,832 |
|
71213 |
Zoos and botanical gardens |
51 |
3,104 |
|
712130 |
Zoos and botanical gardens |
51 |
3,104 |
|
71219 |
Nature parks and other similar institutions |
8 |
77 |
|
712190 |
Nature parks and other similar institutions |
8 |
77 |
|
713 |
Amusement, gambling, and recreation industries |
18,483 |
2,386,699 |
|
7131 |
Amusement parks and arcades |
214 |
72,261 |
|
71311 |
Amusement and theme parks |
128 |
54,839 |
|
713110 |
Amusement and theme parks |
128 |
54,839 |
|
71312 |
Amusement arcades |
86 |
17,422 |
|
713120 |
Amusement arcades |
86 |
17,422 |
|
7132 |
Gambling industries |
815 |
276,717 |
|
71321 |
Casino (except casino hotels) |
304 |
201,901 |
|
713210 |
Casinos (except casino hotels) |
304 |
201,901 |
|
71329 |
Other gambling industries |
511 |
74,816 |
|
713290 |
Other gambling industries |
511 |
74,816 |
|
7139 |
Other amusement and recreation services |
17,454 |
2,037,721 |
|
71391 |
Golf courses and country clubs |
8,764 |
1,004,660 |
|
713910 |
Golf courses and country clubs |
8,764 |
1,004,660 |
|
71392 |
Skiing facilities |
247 |
30,226 |
|
713920 |
Skiing facilities |
247 |
30,226 |
|
71393 |
Marinas |
1,066 |
68,830 |
|
713930 |
Marinas |
1,066 |
68,830 |
|
71394 |
Fitness and recreational sports centers |
1,139 |
86,527 |
|
713940 |
Fitness and recreational sports centers |
1,139 |
86,527 |
|
71395 |
Bowling centers |
3,815 |
471,739 |
|
713950 |
Bowling centers |
3,815 |
471,739 |
|
71399 |
All other amusement and recreation industries |
2,423 |
375,739 |
|
713990 |
All other amusement and recreation industries |
2,423 |
375,739 |
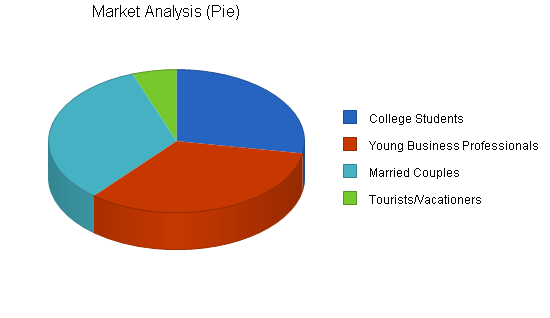
Market Segmentation
The target market can be separated into the following six categories:
College Students: The closeness of EbonySun resort to various colleges and universities will help the resort attract students in and around the Metropolis area. The students will utilize the facility to hang out, spend vacation times and spring break time between semesters. The unique dance and other international themes will attract both U.S. and international students towards these entertainments. The market segmentation of these student category between ages between 18 – 26 is one of the most important customer segments of EbonySun resort. Most of this target market will be single male and female students, who will be interested in exploring new night life entertainment during their young age.
Single Young Business Professionals– The second category of target market is young business professionals in and around our area between 25 and 40. This area has a lot of industries, including Dell, IBM, Tivoli etc. These corporations have lots of young executives, who have enough money to spend on high quality night entertainment. Currently these professionals are spending their time in small night clubs and bars for parties and get-togethers. With the availability of multi-themed entertainment like EbonySun, they will spend major portion of their income for these entertainments.
Married Couples– People who are married and between the ages of 30 to 40, who have either one or two kids or don’t have any kids are targeted for this entertainment. The middle aged people have sound financial income and will be interested in spending an occasional weekend out for party. The Broadway-themed nightclub, and New York- and Paradise Island-themed restaurants will attract these people to enjoy their weekends and holidays in EbonySun.
Tourists/Vacationers– The Metropolis, Gotham area is one of the important tourist areas for visitors from other states and also for the international tourists. This category of people will be interested in getting a unique experience by spending more money. EbonySun provides multilevel dance, hip-hop, and pop entertainment with awide variety of entertainment and restaurant themes in its facility. The tourists can be easily attracted to the facility by creating vacation packages with various airline agencies and local tourist help brokers. The age category can range between 25 – 40 for tourists.
The following table shows data from the U.S. Census Bureau about the various age categories of people within a 20 mile radius of Metropolis. Out of total 5 million people, more than 2 million people can be targeted by EbonySun entertainment.
| Age Group | Estimate |
| 20 to 24 years | 372,591 |
| 25 to 34 years | 899,618 |
| 35 to 44 years | 911,494 |
Need real milestones? We recommend using LivePlan as the easiest way to create milestones for your own business plan. Create your own business plan
| Market Analysis | |||||||
| Year 1 | Year 2 | Year 3 | Year 4 | Year 5 | |||
| Potential Customers | Growth | CAGR | |||||
| College Students | 50% | 749,590 | 1,124,385 | 1,686,578 | 2,529,867 | 3,794,801 | 50.00% |
| Young Business Professionals | 40% | 900,000 | 1,260,000 | 1,764,000 | 2,469,600 | 3,457,440 | 40.00% |
| Married Couples | 30% | 900,000 | 1,170,000 | 1,521,000 | 1,977,300 | 2,570,490 | 30.00% |
| Tourists/Vacationers | 30% | 150,000 | 195,000 | 253,500 | 329,550 | 428,415 | 30.00% |
| Total | 39.59% | 2,699,590 | 3,749,385 | 5,225,078 | 7,306,317 | 10,251,146 | 39.59% |
Target Market Segment Strategy
The market is segmented based on the age and lifestyle category of each group. Market is also segmented into various categories for targeting different types of promotions and advertisements suitable for each target market segment.
College Students:This segmentation is targeted for students of ages between 18 to 26. Students are more interested in drinks and dance and will find value in variety of nightclub theme rooms. The “Vault” nightclub room provides the largest dance floor, the world’s largest multilevel bar with live host concerts, which will definitely attract this market. The “Ozone and Cloud Nine” themes with Ozone dance music, water bars and hot tub bars will attract students to enjoy unique drink and dance entertainment which is not available anywhere in U.S. at this time. The “Carnival” themes will provide South American party theme and this will help targeting the international students. The “Fat Tuesday” with alternate music & metal play will attract students from various nationalities who wants to listen and hangout for a good time in the resort.
Single Young Business Professionals:This segmentation is targeted for young business professional between the ages of 25 and 40. The business professionals will be interested in conducting business parties, client meetings, client entertainment and other social activities in places of unique entertainment. Compared to students, this segment has more potential to spend money in night life entertainment activities. This segment of the market can be attracted with corporate promotions and targeted corporate tie-ups for promotional dinner and entertainment activities. These business executives will enjoy “Sin City”-themed nightclub with unique Las Vegas theme with Ocean’s 11-type movie setup. The large dance floors with rap, hip-hop and rock music will easily attract young professionals. The business executives will be attracted to “Fat Tuesday New Orleans” theme which hold 15 bars and conduct wild parties. Target marketing for these market will be done through corporate promotions and targeted advertising.
Married Couples:This segmentation is for people in the age group of 30 to 40 who are married and are interested in having fun outside. Most of this group will spend weekends in bars and restaurants or any other public entertainment places. This group enjoys 60’s, 70’s & 80’s music theme in “Throw Back Central” which has unique designs like Saturday Night Fever. This group enjoys “Carnival,” “Outer Limits” & “Broadway” themes. The Broadway theme will help them entertain like they are spending nights in the Big Apple. This market can be attracted through unique direct marketing promotions through coupons and free dinner offers.
Tourists & Vacationers:This market targets people who visit this area from other parts of U.S. and other countries. The Metropolis area has over 250,000 tourists annually; approximately 150,000 of them are adults in our targeted age ranges. This market is constantly looking for better entertainment places and will be ready to spend more time and money for these unique entertainment resorts. The age group for this target market can vary between 20 to 40 years. Most of the tourists will be interested in all types of themes since they will get various experiences by visiting at different nightclub themes. This target market can be attracted by selective ad promotion through travel agencies. Tourists can also be attracted through big billboard ads placed near airports and hotels with promotional package advertisements.
Service Business Analysis
EbonySun Entertainment Resort is in the nightlife entertainment industry, along with casinos and other specialty restaurant businesses. The entertainment industry grows tremendously every year, making very good profits for businesses. The major competitors are restaurant, small nightclubs, major restaurant chains, other adult entertainment centers in the vicinity of Gotham/Metropolis area. The U.S. Census Bureau report shows that gambling industry made $20 billion dollars in revenue in Year 2002, out of which Gotham made approximately $8 billion revenue and other gambling industries, including nightclubs, made $7 billion dollars sales revenue. Amusement, Gambling & Recreation industries have grown from $62 billion in 1997 to 65 billion in 2002.
Competition and Buying Patterns
EbonySun is competing against other local nightclubs, but also against movie theatres, mini-golf, rock concerts, bowling, restaurants, plays, symphony performances, and free parties. We are competing for the disposable income and leisure time that our potential customers would otherwise spend elsewhere. However, once a potential customer has decided they want to go out to eat or to go dancing or listening to music, we are most closely competing with similar types of businesses: other restaurants, nightclubs, and concert venues. Our challenge is both to encourage them to choose activities we offer, and then to preferentially choose EbonySun over smaller, less unique options.
The Metropolis area has hundreds of thousands adults, age 21-40, who attend a concert or go out to a nightclub at least once a month. We not only have to encourage customers to come to our venue, but to choose this kind of entertainment over quieter ones. In the nightlife entertainment industry, people make choices about return visits based on the quality of the environment and experience, along with drinks and food. The price should be competitive enough to attract a wide variety of customers.
Strategy and Implementation Summary
EbonySun Entertainment resort utilize the following marketing strategy to win competition in nightlife entertainment.
Differentiation by Innovation in Entertainment – Brand Strategy
- The facility provides world’s best nightlife entertainment with 10 individually- themed nightclub rooms for people with different tastes, 2 VIP Luxury rooms, 4 Restaurants on seating 300 and the other a midnight cafe type of restaurant, 1 Sports Central Game room with over 100 TVs with various world sporting events and over 200 Gaming devices for customer entertainment.
Specialized Products & Service – Create Brand Loyalty
- Large Dance floors, national and international theme-based multi-level nightclubs, live concerts, rock, hip hop, pop, metal music and ozone music entertainment, grill, Tuscan bay, Asian foods pavilion, etc.
Customer Incentive Programs – Repeated Customer Creation
- Satisfy the wants and needs of various target market and make them select EbonySun as one and only place for nightlife entertainment
Aggressive Marketing
- Highly targeted marketing to make people visit the facility. Various consumer and corporate promotional strategies will be used to invite customers to the resort.
Keeping Cost Down
- The management will be stressing the needs to keep the administrative costs down at the same time provide good quality products and service.
Focus on Local Market
- EbonySun concentrates in the Metropolis, Gotham area. The marketing will be initially targeted toward the 5 million people in Gotham. Slowly the marketing programs will expand into other states. By concentrating in local market, the company can use available demographic and behavioral information to create success.
Competitive Edge
The competitive edge of EbonySun Entertainment Resort is its variety of theme-based nightclubs. Such a huge facility is not available in this area or anywhere in United States – you’d have to visit 10 different Las Vegas clubs to get the same variety. The uniqueness of this facility will help us compete successfully against the small bars and nightclubs in the state. It will have the best of the broad entertainment programs with national and international dance and live concert entertainment with availability of various variety of food will create a world class facility for nightlife entertainment.
The location of EbonySun facility is another major factor stressing successful operation. The 150 colleges and universities within a 50 mile radius will help the facility to attract vast majority of students from colleges and universities. With no major competitors in the vicinity, the resort will be able to generate excellent cash flow through entertainment.
To develop good business strategies, perform a SWOT analysis of your business. It's easy with our free guide and template.Learn how to perform a SWOT analysis
Marketing Strategy
The company will use various marketing strategies and tactics to attract the target market to visit the facility. There will be EbonySun Mobile Party Units, which are buses carrying various themes with seating capacity for 10 to 15 people per trip available for transportation between colleges, malls and sports venues to the entertainment resort. This will help promoting the resort and its facility to mass market in Gotham/Metropolis area. The main marketing strategy will be as follows.
Advertising through EbonySun Mobile Party Units
- Buses carrying various themes with seating capacity of 10-15 people shuttle between resort and malls/colleges/sports venues.
Promotional Pricing for College Students
- College Students will be offered initial low price tickets for their first entry to the resort
Media Advertisement
- High quality advertisements will be shown on T.V to attract students, singles and tourist markets
- Magazine ads for the entertainment resort. Selected advertisements will be shown in business, fashion, life style and various youth magazines explaining about the facility and themes based entertainment of the resort.
- Newspaper Ads – Ads will be placed in local and national news papers to create a brand image among people and also to create awareness about the new facility
- Billboards – Billboard advertisement of the resort facility will be kept in major city areas, sports venues and high ways near colleges to attract people towards the resort.
- Radio Ads – Advertisement and promotions will be made through selective radio channels and various competitions and awards will be offered to make the people visit EbonySun facility
Banner Ads
- Banners will be kept during sports venues and major school leagues to create awareness of facility in students markets
Corporate Promotional Pricing
- We will create tie-ins with various corporations to conduct business dinner and parties in EbonySun facility at affordable price
Direct Mail Campaigning
- Flyers and leaflets showing high quality pictures of various entertainment themes will be send by direct mail to people living in Gotham/Metropolis area
Monthly/Yearly Membership Programs
- Company will promote yearly and monthly membership prices which will be lower than regular prices to promote repeated customer visits.
Travel Agency & Hotel Chain Tie-ups and Package Pricing
- Various fliers and ticketing will be made available in travel agencies and major hotels to create awareness among tourists and attract them towards facility.
Sales Strategy
The Sales Strategy is based on making a sale and creating a repeat customer through long-term relationships. The sales force will be divided in territorial areas to concentrate various market segments. Separate teams will be responsible for sales revenue from College Students, Corporate Customers, Couples & Individuals, etc.
The Sales Strategy will be based on the following points.
- Prospecting – Make relationships with customers and generate repeated sales
- Targeting – Targeting will be done through college campaigns, college sports advertisements, corporate get-together promotions, etc.
- Selling – Approach, present, answer questions and make a sale
- Information Gathering – Market research in varying customer attitudes and change sales tactics accordingly
The sales force will be structured based on territorial control. The sales team will be given incentives based of number of new account creations, existing account maintenance, call frequencies to customers, relationship building, etc.
Sales Implementation
The sales force for the college student market will provide promotional pricing, including monthly and yearly membership passes for students market. Various mobile party tours will be conducted, with mobile units providing free travel and entertainment to make initial customer contacts. Separate party and one day free admission will be provided to various people segments to make them come to the nightclubs. We will contact and build relationships with corporate customers which involve separate parties and meeting areas in the facility. Direct Mail sales and marketing will be done with various price promotions to attract local Gotham people to the facility.
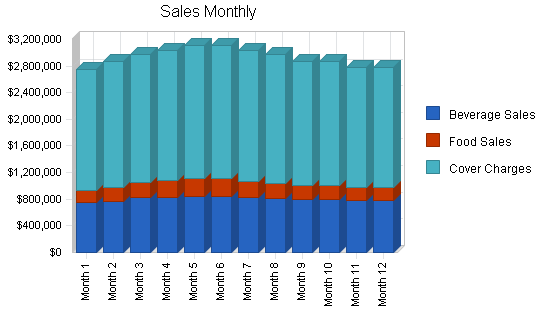
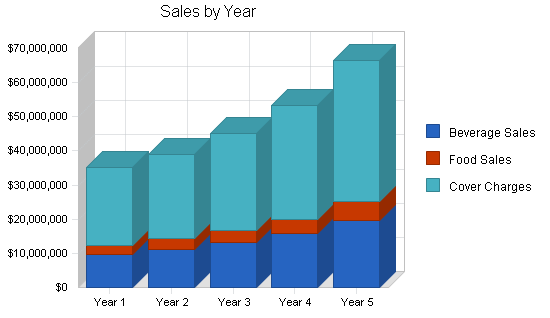
Sales Forecast
The following table and chart shows the sales revenue for each month and projected sales for the next four years by bar beverage sales, restaurant food sales and cover charges for admission. The cover charge applies only to dance and game rooms and bars; restaurant-only customers pay no cover. The sales revenue will increase in coming years due to the increased publicity of this unique facility in Gotham and other parts of U.S. The business revenues are seasonal with highest revenue during spring and summer and reduced revenue during winter seasons.
The sales price also includes all excise taxes charged on food and alcohol. (These are repaid in the Profit and Loss table.)
Need impressive charts? Discover the simplest way to create detailed graphs for your business plan. Create your own business plan
Need real financials? Explore a spreadsheet-free path to generating financial data for your business. Create your own business plan
| Sales Forecast | |||||
| Year 1 | Year 2 | Year 3 | Year 4 | Year 5 | |
| Unit Sales | |||||
| Beverage Sales | 1,608,104 | 1,874,638 | 2,212,072 | 2,654,486 | 3,292,562 |
| Food Sales | 222,850 | 248,709 | 283,528 | 334,563 | 441,858 |
| Cover Charges | 1,141,836 | 1,241,327 | 1,415,112 | 1,669,832 | 2,070,591 |
| Total Unit Sales | 2,972,790 | 3,364,674 | 3,910,712 | 4,658,881 | 5,805,011 |
| Unit Prices | Year 1 | Year 2 | Year 3 | Year 4 | Year 5 |
| Beverage Sales | $6.00 | $6.00 | $6.00 | $6.00 | $6.00 |
| Food Sales | $12.00 | $12.00 | $12.00 | $12.00 | $12.00 |
| Cover Charges | $20.00 | $20.00 | $20.00 | $20.00 | $20.00 |
| Sales | |||||
| Beverage Sales | $9,648,624 | $11,247,828 | $13,272,432 | $15,926,916 | $19,755,372 |
| Food Sales | $2,674,200 | $2,984,508 | $3,402,336 | $4,014,756 | $5,302,296 |
| Cover Charges | $22,836,720 | $24,826,540 | $28,302,240 | $33,396,640 | $41,411,820 |
| Total Sales | $35,159,544 | $39,058,876 | $44,977,008 | $53,338,312 | $66,469,488 |
| Direct Unit Costs | Year 1 | Year 2 | Year 3 | Year 4 | Year 5 |
| Beverage Sales | $2.10 | $2.10 | $2.10 | $2.10 | $2.10 |
| Food Sales | $3.96 | $3.96 | $3.96 | $3.96 | $3.96 |
| Cover Charges | $0.60 | $0.60 | $0.60 | $0.60 | $0.60 |
| Direct Cost of Sales | |||||
| Beverage Sales | $3,377,018 | $3,936,740 | $4,645,351 | $5,574,421 | $6,914,380 |
| Food Sales | $882,486 | $984,888 | $1,122,771 | $1,324,869 | $1,749,758 |
| Cover Charges | $685,102 | $744,796 | $849,067 | $1,001,899 | $1,242,355 |
| Subtotal Direct Cost of Sales | $4,944,606 | $5,666,424 | $6,617,189 | $7,901,189 | $9,906,492 |
Web Plan Summary
BigBank Corporation will create a unique website for Supernova Entertainment Resort. The website will provide all information regarding the facility, directions to facility, timings, various themes and entertainment details etc. The website also allows people to make reservation online for special parties and dinner. The website will create various promotional advertisements targeted towards college students and other net-savvy customers.

Management Summary
The EbonySun Entertainment Resort will have the same operational structure as a casino. The company will stress the importance of security to customer enjoyment, and creating a unique customer entertainment experience. The facility will have the following managers in its organizational structure:
- General Manager– General Manager will be responsible for overall business management dealing with various sales, marketing , HR, Finance & Security groups in the facility. General Manager will have good industry experience in a similar industry with a wide range of people and management skills.
- Marketing and Advertising Manager– This Manager will be reporting to the General Manager and will be responsible for setting up sales and marketing strategies. The Marketing & Advertising manager selects channels of advertisement, sets sales revenue targets, create marketing promotional plans and manage sales and marketing team. M&A Manager will be responsible for creating repeat customers through customer-oriented sales strategy.
- Human Resources and Administrations Manager– HR & Administrations Manager is responsible for selecting and recruiting people for the facility. The HR department will be responsible for daily administration and problem resolutions among customers and employees. HR department will create policies to make the facility a better place to work and maintain day to day administration tasks. HR will provide various training for the employees to increase their awareness to treat customers with highest quality of service.
- Financial Operations Manager– The Financial Operations Manager will be responsible for finance and accounting of company’s revenue and expenses. The Financial Manager will create policies to reduce the operations cost to a minimum and increase revenue of the firm. The Financial Manager will be responsible for accounting of daily profits from various revenue streams, calculating inventory, tracking daily operational expenses, projecting advertising expenses, etc. Financial Operations Manager will communicate with other functional managers to make the facility profitable through cost-effective financial methods implementation.
- Security Manager– Security Manager will be responsible for keeping the environment safe and secured for the customers. The Security Manager will prevent and handle any fights or conflicts of various kinds between customers. The security manager will manage the security personnel and implement various remote monitoring technologies to improve the safety and security of resort customers.
Personnel Plan
The EbonySun resort will have five managers: General Manager, Marketing & Advertising Manager, Human Resources & Administrations Manager, Financial Operations Manager, and Security Manager.
The resort also employs full and part-time employees in the following categories:
- 25 – 50 Security Guards
- 30 Bartenders
- 30 – 40 Waitresses
- 15 – 20 Members of Kitchen Staff
- 10 Back office staff
- 10 – 12 Host & Hostess
- 10 – 15 After-hours cleaning staff
- 10 DJs
- 3 Computer Staff
| Personnel Plan | |||||
| Year 1 | Year 2 | Year 3 | Year 4 | Year 5 | |
| Security Guards | $518,400 | $528,400 | $538,400 | $548,400 | $558,400 |
| Bar Personnel | $399,600 | $409,600 | $419,600 | $429,600 | $439,600 |
| Waitress | $504,000 | $512,000 | $520,000 | $528,000 | $536,000 |
| Kitchen Staff | $232,200 | $237,200 | $242,200 | $247,200 | $252,200 |
| Back Office Staff | $126,000 | $128,000 | $130,000 | $132,000 | $134,000 |
| Host & Hostess | $172,800 | $175,800 | $178,800 | $181,800 | $184,800 |
| Cleaning Staff | $129,600 | $130,000 | $131,000 | $132,000 | $133,000 |
| DJ’s | $540,000 | $560,000 | $580,000 | $600,000 | $620,000 |
| General Manager | $120,000 | $130,000 | $140,000 | $150,000 | $160,000 |
| Marketing & Advertising Manager | $96,000 | $100,000 | $105,000 | $110,000 | $115,000 |
| HR & Administrations Manager | $72,000 | $80,000 | $85,000 | $90,000 | $95,000 |
| Financial Operations Manager | $108,000 | $118,000 | $123,000 | $128,000 | $133,000 |
| Security Manager | $72,000 | $80,000 | $83,000 | $87,000 | $91,000 |
| Computer Staff | $120,000 | $130,000 | $140,000 | $150,000 | $160,000 |
| Total People | 172 | 172 | 182 | 192 | 200 |
| Total Payroll | $3,210,600 | $3,319,000 | $3,416,000 | $3,514,000 | $3,612,000 |
Financial Plan
EbonySun will be a vast undertaking, requiring extensive start-up funding, but paying off handsomely within a short period.
The project funding is done by collecting $5.96 million dollars through equity financing from venture capitalists, private investors etc. The company owners will invest a portion of the money for initial startup. The company is managed by experienced professionals in the entertainment and casino industry.
Start-up Funding
The startup funding for EbonySun Entertainment Resort comes from investors and venture capitalists. The resort project requires a start-up investment of $5.96 million dollars.
| Start-up Funding | |
| Start-up Expenses to Fund | $5,250,000 |
| Start-up Assets to Fund | $2,710,000 |
| Total Funding Required | $7,960,000 |
| Assets | |
| Non-cash Assets from Start-up | $2,210,000 |
| Cash Requirements from Start-up | $500,000 |
| Additional Cash Raised | $0 |
| Cash Balance on Starting Date | $500,000 |
| Total Assets | $2,710,000 |
| Liabilities and Capital | |
| Liabilities | |
| Current Borrowing | $0 |
| Long-term Liabilities | $0 |
| Accounts Payable (Outstanding Bills) | $0 |
| Other Current Liabilities (interest-free) | $0 |
| Total Liabilities | $0 |
| Capital | |
| Planned Investment | |
| Owner | $2,000,000 |
| Investor | $5,960,000 |
| Additional Investment Requirement | $0 |
| Total Planned Investment | $7,960,000 |
| Loss at Start-up (Start-up Expenses) | ($5,250,000) |
| Total Capital | $2,710,000 |
| Total Capital and Liabilities | $2,710,000 |
| Total Funding | $7,960,000 |
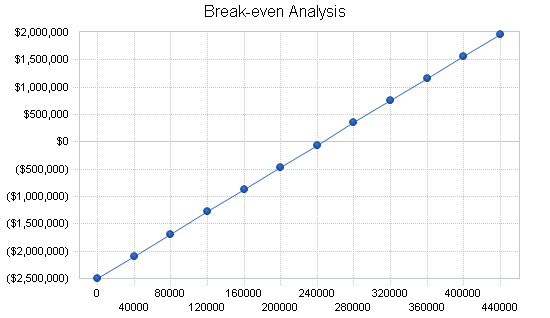
Break-even Analysis
The Break-even analysis shows the number of units of sales required for the facility to make profit over the fixed costs.
Need actual charts? We recommend using LivePlan as the easiest way to create graphs for your own business plan. Create your own business plan
| Break-even Analysis | |
| Monthly Units Break-even | 246,142 |
| Monthly Revenue Break-even | $2,911,155 |
| Assumptions: | |
| Average Per-Unit Revenue | $11.83 |
| Average Per-Unit Variable Cost | $1.66 |
| Estimated Monthly Fixed Cost | $2,501,750 |
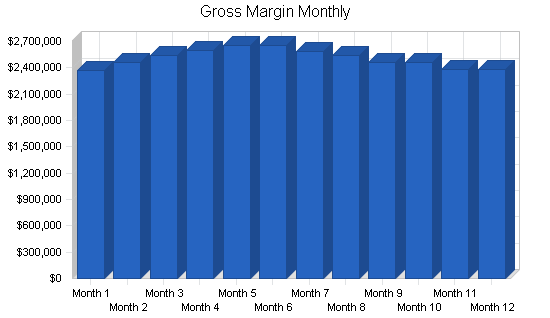
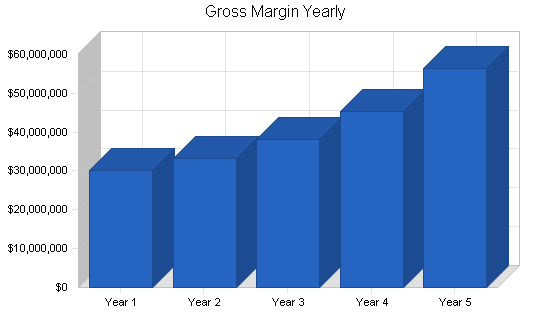
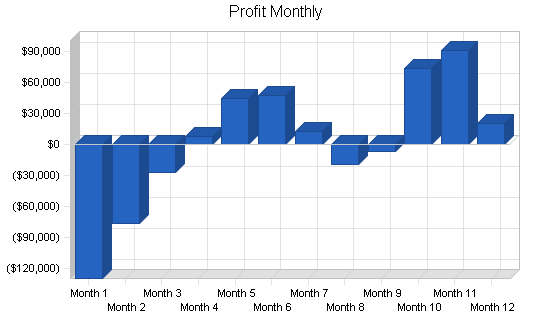
Projected Profit and Loss
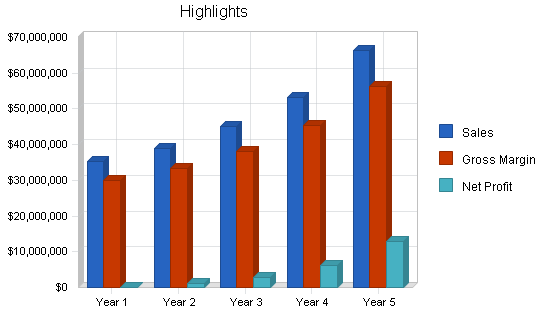
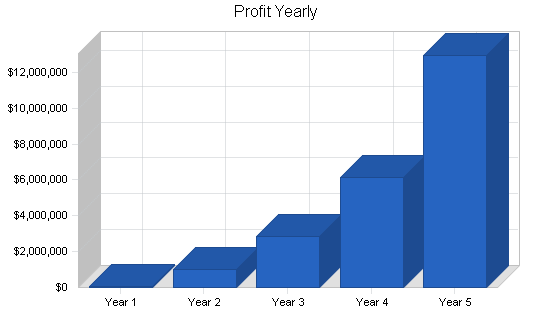
The following table and charts show the projected Profit and Loss for EbonySun. We expect to become profitable in the second year, as satisfied customers become repeat customers, and word-of-mouth about the resort spreads. We expect an increase in the tourist contingent, especially. As the Profit and Loss table shows, the company expects to see a steady growth in profitability over the next five years of operations.
Need real financials? We recommend using LivePlan as the easiest way to create financials for your own business plan. Create your own business plan
Need real financials? We recommend using LivePlan as the easiest way to create financials for your own business plan. Create your own business plan
Need real milestones? We recommend using LivePlan as the easiest way to create milestones for your own business plan. Create your own business plan
Need real financials? We recommend using LivePlan as the easiest way to create financials for your own business plan. Create your own business plan
| Pro Forma Profit and Loss | |||||
| Year 1 | Year 2 | Year 3 | Year 4 | Year 5 | |
| Sales | $35,159,544 | $39,058,876 | $44,977,008 | $53,338,312 | $66,469,488 |
| Direct Cost of Sales | $4,944,606 | $5,666,424 | $6,617,189 | $7,901,189 | $9,906,492 |
| Other Costs of Sales | $137,060 | $147,000 | $152,000 | $160,000 | $170,000 |
| Total Cost of Sales | $5,081,666 | $5,813,424 | $6,769,189 | $8,061,189 | $10,076,492 |
| Gross Margin | $30,077,878 | $33,245,452 | $38,207,819 | $45,277,123 | $56,392,996 |
| Gross Margin % | 85.55% | 85.12% | 84.95% | 84.89% | 84.84% |
| Expenses | |||||
| Payroll | $3,210,600 | $3,319,000 | $3,416,000 | $3,514,000 | $3,612,000 |
| Sales and Marketing | $1,040,000 | $1,100,000 | $1,200,000 | $1,300,000 | $1,400,000 |
| Depreciation | $60,000 | $60,000 | $60,000 | $60,000 | $60,000 |
| Advertising | $8,800,000 | $9,000,000 | $10,000,000 | $11,000,000 | $12,000,000 |
| Professional-Fees | $3,210,600 | $3,310,600 | $3,410,600 | $3,510,600 | $3,610,600 |
| Office Supplies | $840,000 | $880,000 | $900,000 | $920,000 | $930,000 |
| Excise Taxes paid out | $9,643,296 | $10,843,296 | $11,843,296 | $12,843,296 | $12,843,296 |
| Utilities | $1,200,000 | $1,240,000 | $1,260,000 | $1,280,000 | $1,300,000 |
| Telephone | $960,000 | $950,000 | $960,000 | $968,000 | $978,000 |
| Insurance | $840,000 | $845,000 | $850,000 | $855,000 | $860,000 |
| Property Taxes | $96,000 | $101,000 | $107,000 | $111,000 | $115,000 |
| Web Development | $48,000 | $50,000 | $52,000 | $54,000 | $56,000 |
| House Keeping Supplies | $72,500 | $80,000 | $90,000 | $100,000 | $110,000 |
| Payroll Taxes | $0 | $0 | $0 | $0 | $0 |
| Total Operating Expenses | $30,020,996 | $31,778,896 | $34,148,896 | $36,515,896 | $37,874,896 |
| Profit Before Interest and Taxes | $56,882 | $1,466,556 | $4,058,923 | $8,761,227 | $18,518,100 |
| EBITDA | $116,882 | $1,526,556 | $4,118,923 | $8,821,227 | $18,578,100 |
| Interest Expense | $0 | $0 | $0 | $0 | $0 |
| Taxes Incurred | $17,065 | $439,967 | $1,217,677 | $2,628,368 | $5,555,430 |
| Net Profit | $39,817 | $1,026,589 | $2,841,246 | $6,132,859 | $12,962,670 |
| Net Profit/Sales | 0.11% | 2.63% | 6.32% | 11.50% | 19.50% |
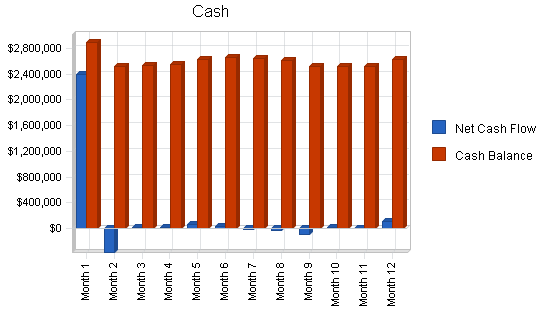
Projected Cash Flow
The cash flow projection shows that provisions for ongoing expenses are adequate to meet the needs of the company, as the business generates sufficient cash flow to support operations. The table also shows dividends paid out to all investors in later years; dividends will be distributed according to equity percent owned.
Need real milestones? We recommend using LivePlan as the easiest way to create milestones for your own business plan. Create your own business plan
| Pro Forma Cash Flow | |||||
| Year 1 | Year 2 | Year 3 | Year 4 | Year 5 | |
| Cash Received | |||||
| Cash from Operations | |||||
| Cash Sales | $35,159,544 | $39,058,876 | $44,977,008 | $53,338,312 | $66,469,488 |
| Subtotal Cash from Operations | $35,159,544 | $39,058,876 | $44,977,008 | $53,338,312 | $66,469,488 |
| Additional Cash Received | |||||
| Sales Tax, VAT, HST/GST Received | $0 | $0 | $0 | $0 | $0 |
| New Current Borrowing | $0 | $0 | $0 | $0 | $0 |
| New Other Liabilities (interest-free) | $0 | $0 | $0 | $0 | $0 |
| New Long-term Liabilities | $0 | $0 | $0 | $0 | $0 |
| Sales of Other Current Assets | $0 | $0 | $0 | $0 | $0 |
| Sales of Long-term Assets | $0 | $0 | $0 | $0 | $0 |
| New Investment Received | $0 | $0 | $0 | $0 | $0 |
| Subtotal Cash Received | $35,159,544 | $39,058,876 | $44,977,008 | $53,338,312 | $66,469,488 |
| Expenditures | Year 1 | Year 2 | Year 3 | Year 4 | Year 5 |
| Expenditures from Operations | |||||
| Cash Spending | $3,210,600 | $3,319,000 | $3,416,000 | $3,514,000 | $3,612,000 |
| Bill Payments | $29,823,471 | $34,349,588 | $38,437,107 | $43,361,819 | $49,565,055 |
| Subtotal Spent on Operations | $33,034,071 | $37,668,588 | $41,853,107 | $46,875,819 | $53,177,055 |
| Additional Cash Spent | |||||
| Sales Tax, VAT, HST/GST Paid Out | $0 | $0 | $0 | $0 | $0 |
| Principal Repayment of Current Borrowing | $0 | $0 | $0 | $0 | $0 |
| Other Liabilities Principal Repayment | $0 | $0 | $0 | $0 | $0 |
| Long-term Liabilities Principal Repayment | $0 | $0 | $0 | $0 | $0 |
| Purchase Other Current Assets | $0 | $0 | $0 | $0 | $0 |
| Purchase Long-term Assets | $0 | $0 | $0 | $0 | $0 |
| Dividends | $0 | $0 | $2,000,000 | $5,000,000 | $10,000,000 |
| Subtotal Cash Spent | $33,034,071 | $37,668,588 | $43,853,107 | $51,875,819 | $63,177,055 |
| Net Cash Flow | $2,125,473 | $1,390,288 | $1,123,901 | $1,462,493 | $3,292,433 |
| Cash Balance | $2,625,473 | $4,015,761 | $5,139,662 | $6,602,154 | $9,894,587 |
Projected Balance Sheet
The balance sheet shows healthy growth of net worth, and strong financial position. The net worth grows over the years as shown in the following table.
| Pro Forma Balance Sheet | |||||
| Year 1 | Year 2 | Year 3 | Year 4 | Year 5 | |
| Assets | |||||
| Current Assets | |||||
| Cash | $2,625,473 | $4,015,761 | $5,139,662 | $6,602,154 | $9,894,587 |
| Inventory | $391,812 | $541,134 | $643,957 | $786,195 | $1,035,061 |
| Other Current Assets | $200,000 | $200,000 | $200,000 | $200,000 | $200,000 |
| Total Current Assets | $3,217,285 | $4,756,895 | $5,983,619 | $7,588,349 | $11,129,648 |
| Long-term Assets | |||||
| Long-term Assets | $2,000,000 | $2,000,000 | $2,000,000 | $2,000,000 | $2,000,000 |
| Accumulated Depreciation | $60,000 | $120,000 | $180,000 | $240,000 | $300,000 |
| Total Long-term Assets | $1,940,000 | $1,880,000 | $1,820,000 | $1,760,000 | $1,700,000 |
| Total Assets | $5,157,285 | $6,636,895 | $7,803,619 | $9,348,349 | $12,829,648 |
| Liabilities and Capital | Year 1 | Year 2 | Year 3 | Year 4 | Year 5 |
| Current Liabilities | |||||
| Accounts Payable | $2,407,468 | $2,860,488 | $3,185,966 | $3,597,838 | $4,116,467 |
| Current Borrowing | $0 | $0 | $0 | $0 | $0 |
| Other Current Liabilities | $0 | $0 | $0 | $0 | $0 |
| Subtotal Current Liabilities | $2,407,468 | $2,860,488 | $3,185,966 | $3,597,838 | $4,116,467 |
| Long-term Liabilities | $0 | $0 | $0 | $0 | $0 |
| Total Liabilities | $2,407,468 | $2,860,488 | $3,185,966 | $3,597,838 | $4,116,467 |
| Paid-in Capital | $7,960,000 | $7,960,000 | $7,960,000 | $7,960,000 | $7,960,000 |
| Retained Earnings | ($5,250,000) | ($5,210,183) | ($6,183,593) | ($8,342,347) | ($12,209,489) |
| Earnings | $39,817 | $1,026,589 | $2,841,246 | $6,132,859 | $12,962,670 |
| Total Capital | $2,749,817 | $3,776,407 | $4,617,653 | $5,750,511 | $8,713,181 |
| Total Liabilities and Capital | $5,157,285 | $6,636,895 | $7,803,619 | $9,348,349 | $12,829,648 |
| Net Worth | $2,749,817 | $3,776,407 | $4,617,653 | $5,750,511 | $8,713,181 |
Business Ratios
Business ratios for the years of this plan are shown below. Industry profile ratios based on the Standard Industrial Classification (SIC) code 5813.02, Night Clubs, are shown for comparison. We expect to maintain healthy ratios for profitability, risk, and return.
| Ratio Analysis | ||||||
| Year 1 | Year 2 | Year 3 | Year 4 | Year 5 | Industry Profile | |
| Sales Growth | n.a. | 11.09% | 15.15% | 18.59% | 24.62% | 1.81% |
| Percent of Total Assets | ||||||
| Inventory | 7.60% | 8.15% | 8.25% | 8.41% | 8.07% | 3.76% |
| Other Current Assets | 3.88% | 3.01% | 2.56% | 2.14% | 1.56% | 45.60% |
| Total Current Assets | 62.38% | 71.67% | 76.68% | 81.17% | 86.75% | 53.77% |
| Long-term Assets | 37.62% | 28.33% | 23.32% | 18.83% | 13.25% | 46.23% |
| Total Assets | 100.00% | 100.00% | 100.00% | 100.00% | 100.00% | 100.00% |
| Current Liabilities | 46.68% | 43.10% | 40.83% | 38.49% | 32.09% | 17.55% |
| Long-term Liabilities | 0.00% | 0.00% | 0.00% | 0.00% | 0.00% | 27.98% |
| Total Liabilities | 46.68% | 43.10% | 40.83% | 38.49% | 32.09% | 45.53% |
| Net Worth | 53.32% | 56.90% | 59.17% | 61.51% | 67.91% | 54.47% |
| Percent of Sales | ||||||
| Sales | 100.00% | 100.00% | 100.00% | 100.00% | 100.00% | 100.00% |
| Gross Margin | 85.55% | 85.12% | 84.95% | 84.89% | 84.84% | 47.12% |
| Selling, General & Administrative Expenses | 85.43% | 82.49% | 78.63% | 73.39% | 65.34% | 27.00% |
| Advertising Expenses | 9.13% | 8.48% | 7.58% | 6.58% | 5.43% | 3.86% |
| Profit Before Interest and Taxes | 0.16% | 3.75% | 9.02% | 16.43% | 27.86% | 2.83% |
| Main Ratios | ||||||
| Current | 1.34 | 1.66 | 1.88 | 2.11 | 2.70 | 1.05 |
| Quick | 1.17 | 1.47 | 1.68 | 1.89 | 2.45 | 0.58 |
| Total Debt to Total Assets | 46.68% | 43.10% | 40.83% | 38.49% | 32.09% | 50.35% |
| Pre-tax Return on Net Worth | 2.07% | 38.83% | 87.90% | 152.36% | 212.53% | 4.76% |
| Pre-tax Return on Assets | 1.10% | 22.10% | 52.01% | 93.72% | 144.34% | 9.59% |
| Additional Ratios | Year 1 | Year 2 | Year 3 | Year 4 | Year 5 | |
| Net Profit Margin | 0.11% | 2.63% | 6.32% | 11.50% | 19.50% | n.a |
| Return on Equity | 1.45% | 27.18% | 61.53% | 106.65% | 148.77% | n.a |
| Activity Ratios | ||||||
| Inventory Turnover | 12.00 | 12.15 | 11.17 | 11.05 | 10.88 | n.a |
| Accounts Payable Turnover | 13.39 | 12.17 | 12.17 | 12.17 | 12.17 | n.a |
| Payment Days | 27 | 28 | 28 | 28 | 28 | n.a |
| Total Asset Turnover | 6.82 | 5.89 | 5.76 | 5.71 | 5.18 | n.a |
| Debt Ratios | ||||||
| Debt to Net Worth | 0.88 | 0.76 | 0.69 | 0.63 | 0.47 | n.a |
| Current Liab. to Liab. | 1.00 | 1.00 | 1.00 | 1.00 | 1.00 | n.a |
| Liquidity Ratios | ||||||
| Net Working Capital | $809,817 | $1,896,407 | $2,797,653 | $3,990,511 | $7,013,181 | n.a |
| Interest Coverage | 0.00 | 0.00 | 0.00 | 0.00 | 0.00 | n.a |
| Additional Ratios | ||||||
| Assets to Sales | 0.15 | 0.17 | 0.17 | 0.18 | 0.19 | n.a |
| Current Debt/Total Assets | 47% | 43% | 41% | 38% | 32% | n.a |
| Acid Test | 1.17 | 1.47 | 1.68 | 1.89 | 2.45 | n.a |
| Sales/Net Worth | 12.79 | 10.34 | 9.74 | 9.28 | 7.63 | n.a |
| Dividend Payout | 0.00 | 0.00 | 0.70 | 0.82 | 0.77 | n.a |
Appendix
| Sales Forecast | |||||||||||||
| Month 1 | Month 2 | Month 3 | Month 4 | Month 5 | Month 6 | Month 7 | Month 8 | Month 9 | Month 10 | Month 11 | Month 12 | ||
| Unit Sales | |||||||||||||
| Beverage Sales | 0% | 125,500 | 128,800 | 136,802 | 138,800 | 140,000 | 140,000 | 137,802 | 135,600 | 132,200 | 132,200 | 130,200 | 130,200 |
| Food Sales | 0% | 15,200 | 17,200 | 19,200 | 20,200 | 22,500 | 22,500 | 20,300 | 18,550 | 17,400 | 17,400 | 16,200 | 16,200 |
| Cover Charges | 0% | 90,984 | 94,284 | 96,284 | 98,284 | 99,800 | 99,800 | 98,000 | 96,800 | 93,400 | 93,400 | 90,400 | 90,400 |
| Total Unit Sales | 231,684 | 240,284 | 252,286 | 257,284 | 262,300 | 262,300 | 256,102 | 250,950 | 243,000 | 243,000 | 236,800 | 236,800 | |
| Unit Prices | Month 1 | Month 2 | Month 3 | Month 4 | Month 5 | Month 6 | Month 7 | Month 8 | Month 9 | Month 10 | Month 11 | Month 12 | |
| Beverage Sales | $6.00 | $6.00 | $6.00 | $6.00 | $6.00 | $6.00 | $6.00 | $6.00 | $6.00 | $6.00 | $6.00 | $6.00 | |
| Food Sales | $12.00 | $12.00 | $12.00 | $12.00 | $12.00 | $12.00 | $12.00 | $12.00 | $12.00 | $12.00 | $12.00 | $12.00 | |
| Cover Charges | $20.00 | $20.00 | $20.00 | $20.00 | $20.00 | $20.00 | $20.00 | $20.00 | $20.00 | $20.00 | $20.00 | $20.00 | |
| Sales | |||||||||||||
| Beverage Sales | $753,000 | $772,800 | $820,812 | $832,800 | $840,000 | $840,000 | $826,812 | $813,600 | $793,200 | $793,200 | $781,200 | $781,200 | |
| Food Sales | $182,400 | $206,400 | $230,400 | $242,400 | $270,000 | $270,000 | $243,600 | $222,600 | $208,800 | $208,800 | $194,400 | $194,400 | |
| Cover Charges | $1,819,680 | $1,885,680 | $1,925,680 | $1,965,680 | $1,996,000 | $1,996,000 | $1,960,000 | $1,936,000 | $1,868,000 | $1,868,000 | $1,808,000 | $1,808,000 | |
| Total Sales | $2,755,080 | $2,864,880 | $2,976,892 | $3,040,880 | $3,106,000 | $3,106,000 | $3,030,412 | $2,972,200 | $2,870,000 | $2,870,000 | $2,783,600 | $2,783,600 | |
| Direct Unit Costs | Month 1 | Month 2 | Month 3 | Month 4 | Month 5 | Month 6 | Month 7 | Month 8 | Month 9 | Month 10 | Month 11 | Month 12 | |
| Beverage Sales | 35.00% | $2.10 | $2.10 | $2.10 | $2.10 | $2.10 | $2.10 | $2.10 | $2.10 | $2.10 | $2.10 | $2.10 | $2.10 |
| Food Sales | 33.00% | $3.96 | $3.96 | $3.96 | $3.96 | $3.96 | $3.96 | $3.96 | $3.96 | $3.96 | $3.96 | $3.96 | $3.96 |
| Cover Charges | 3.00% | $0.60 | $0.60 | $0.60 | $0.60 | $0.60 | $0.60 | $0.60 | $0.60 | $0.60 | $0.60 | $0.60 | $0.60 |
| Direct Cost of Sales | |||||||||||||
| Beverage Sales | $263,550 | $270,480 | $287,284 | $291,480 | $294,000 | $294,000 | $289,384 | $284,760 | $277,620 | $277,620 | $273,420 | $273,420 | |
| Food Sales | $60,192 | $68,112 | $76,032 | $79,992 | $89,100 | $89,100 | $80,388 | $73,458 | $68,904 | $68,904 | $64,152 | $64,152 | |
| Cover Charges | $54,590 | $56,570 | $57,770 | $58,970 | $59,880 | $59,880 | $58,800 | $58,080 | $56,040 | $56,040 | $54,240 | $54,240 | |
| Subtotal Direct Cost of Sales | $378,332 | $395,162 | $421,087 | $430,442 | $442,980 | $442,980 | $428,572 | $416,298 | $402,564 | $402,564 | $391,812 | $391,812 |
| Personnel Plan | |||||||||||||
| Month 1 | Month 2 | Month 3 | Month 4 | Month 5 | Month 6 | Month 7 | Month 8 | Month 9 | Month 10 | Month 11 | Month 12 | ||
| Security Guards | 0% | $43,200 | $43,200 | $43,200 | $43,200 | $43,200 | $43,200 | $43,200 | $43,200 | $43,200 | $43,200 | $43,200 | $43,200 |
| Bar Personnel | 0% | $33,300 | $33,300 | $33,300 | $33,300 | $33,300 | $33,300 | $33,300 | $33,300 | $33,300 | $33,300 | $33,300 | $33,300 |
| Waitress | 0% | $42,000 | $42,000 | $42,000 | $42,000 | $42,000 | $42,000 | $42,000 | $42,000 | $42,000 | $42,000 | $42,000 | $42,000 |
| Kitchen Staff | 0% | $19,350 | $19,350 | $19,350 | $19,350 | $19,350 | $19,350 | $19,350 | $19,350 | $19,350 | $19,350 | $19,350 | $19,350 |
| Back Office Staff | 0% | $10,500 | $10,500 | $10,500 | $10,500 | $10,500 | $10,500 | $10,500 | $10,500 | $10,500 | $10,500 | $10,500 | $10,500 |
| Host & Hostess | 0% | $14,400 | $14,400 | $14,400 | $14,400 | $14,400 | $14,400 | $14,400 | $14,400 | $14,400 | $14,400 | $14,400 | $14,400 |
| Cleaning Staff | 0% | $10,800 | $10,800 | $10,800 | $10,800 | $10,800 | $10,800 | $10,800 | $10,800 | $10,800 | $10,800 | $10,800 | $10,800 |
| DJ’s | 0% | $45,000 | $45,000 | $45,000 | $45,000 | $45,000 | $45,000 | $45,000 | $45,000 | $45,000 | $45,000 | $45,000 | $45,000 |
| General Manager | 0% | $10,000 | $10,000 | $10,000 | $10,000 | $10,000 | $10,000 | $10,000 | $10,000 | $10,000 | $10,000 | $10,000 | $10,000 |
| Marketing & Advertising Manager | 0% | $8,000 | $8,000 | $8,000 | $8,000 | $8,000 | $8,000 | $8,000 | $8,000 | $8,000 | $8,000 | $8,000 | $8,000 |
| HR & Administrations Manager | 0% | $6,000 | $6,000 | $6,000 | $6,000 | $6,000 | $6,000 | $6,000 | $6,000 | $6,000 | $6,000 | $6,000 | $6,000 |
| Financial Operations Manager | 0% | $9,000 | $9,000 | $9,000 | $9,000 | $9,000 | $9,000 | $9,000 | $9,000 | $9,000 | $9,000 | $9,000 | $9,000 |
| Security Manager | 0% | $6,000 | $6,000 | $6,000 | $6,000 | $6,000 | $6,000 | $6,000 | $6,000 | $6,000 | $6,000 | $6,000 | $6,000 |
| Computer Staff | 0% | $10,000 | $10,000 | $10,000 | $10,000 | $10,000 | $10,000 | $10,000 | $10,000 | $10,000 | $10,000 | $10,000 | $10,000 |
| Total People | 172 | 172 | 172 | 172 | 172 | 172 | 172 | 172 | 172 | 172 | 172 | 172 | |
| Total Payroll | $267,550 | $267,550 | $267,550 | $267,550 | $267,550 | $267,550 | $267,550 | $267,550 | $267,550 | $267,550 | $267,550 | $267,550 |
| Pro Forma Profit and Loss | |||||||||||||
| Month 1 | Month 2 | Month 3 | Month 4 | Month 5 | Month 6 | Month 7 | Month 8 | Month 9 | Month 10 | Month 11 | Month 12 | ||
| Sales | $2,755,080 | $2,864,880 | $2,976,892 | $3,040,880 | $3,106,000 | $3,106,000 | $3,030,412 | $2,972,200 | $2,870,000 | $2,870,000 | $2,783,600 | $2,783,600 | |
| Direct Cost of Sales | $378,332 | $395,162 | $421,087 | $430,442 | $442,980 | $442,980 | $428,572 | $416,298 | $402,564 | $402,564 | $391,812 | $391,812 | |
| Other Costs of Sales | $10,000 | $12,000 | $12,500 | $12,560 | $12,600 | $12,600 | $12,200 | $11,800 | $10,200 | $10,200 | $10,200 | $10,200 | |
| Total Cost of Sales | $388,332 | $407,162 | $433,587 | $443,002 | $455,580 | $455,580 | $440,772 | $428,098 | $412,764 | $412,764 | $402,012 | $402,012 | |
| Gross Margin | $2,366,748 | $2,457,718 | $2,543,305 | $2,597,878 | $2,650,420 | $2,650,420 | $2,589,640 | $2,544,102 | $2,457,236 | $2,457,236 | $2,381,588 | $2,381,588 | |
| Gross Margin % | 85.90% | 85.79% | 85.43% | 85.43% | 85.33% | 85.33% | 85.46% | 85.60% | 85.62% | 85.62% | 85.56% | 85.56% | |
| Expenses | |||||||||||||
| Payroll | $267,550 | $267,550 | $267,550 | $267,550 | $267,550 | $267,550 | $267,550 | $267,550 | $267,550 | $267,550 | $267,550 | $267,550 | |
| Sales and Marketing | $80,000 | $90,000 | $100,000 | $100,000 | $100,000 | $95,000 | $90,000 | $90,000 | $85,000 | $70,000 | $70,000 | $70,000 | |
| Depreciation | $5,000 | $5,000 | $5,000 | $5,000 | $5,000 | $5,000 | $5,000 | $5,000 | $5,000 | $5,000 | $5,000 | $5,000 | |
| Advertising | $800,000 | $800,000 | $800,000 | $800,000 | $800,000 | $800,000 | $800,000 | $800,000 | $700,000 | $600,000 | $500,000 | $600,000 | |
| Professional-Fees | $267,550 | $267,550 | $267,550 | $267,550 | $267,550 | $267,550 | $267,550 | $267,550 | $267,550 | $267,550 | $267,550 | $267,550 | |
| Office Supplies | $70,000 | $70,000 | $70,000 | $70,000 | $70,000 | $70,000 | $70,000 | $70,000 | $70,000 | $70,000 | $70,000 | $70,000 | |
| Excise Taxes paid out | $803,608 | $803,608 | $803,608 | $803,608 | $803,608 | $803,608 | $803,608 | $803,608 | $803,608 | $803,608 | $803,608 | $803,608 | |
| Utilities | $100,000 | $100,000 | $100,000 | $100,000 | $100,000 | $100,000 | $100,000 | $100,000 | $100,000 | $100,000 | $100,000 | $100,000 | |
| Telephone | $70,000 | $75,000 | $80,000 | $85,000 | $85,000 | $85,000 | $80,000 | $80,000 | $80,000 | $80,000 | $80,000 | $80,000 | |
| Insurance | $70,000 | $70,000 | $70,000 | $70,000 | $70,000 | $70,000 | $70,000 | $70,000 | $70,000 | $70,000 | $70,000 | $70,000 | |
| Property Taxes | $8,000 | $8,000 | $8,000 | $8,000 | $8,000 | $8,000 | $8,000 | $8,000 | $8,000 | $8,000 | $8,000 | $8,000 | |
| Web Development | $4,000 | $4,000 | $4,000 | $4,000 | $4,000 | $4,000 | $4,000 | $4,000 | $4,000 | $4,000 | $4,000 | $4,000 | |
| House Keeping Supplies | 15% | $6,000 | $6,000 | $6,000 | $6,000 | $6,000 | $6,000 | $6,000 | $6,000 | $6,000 | $6,000 | $6,000 | $6,500 |
| Payroll Taxes | 15% | $0 | $0 | $0 | $0 | $0 | $0 | $0 | $0 | $0 | $0 | $0 | $0 |
| Total Operating Expenses | $2,551,708 | $2,566,708 | $2,581,708 | $2,586,708 | $2,586,708 | $2,581,708 | $2,571,708 | $2,571,708 | $2,466,708 | $2,351,708 | $2,251,708 | $2,352,208 | |
| Profit Before Interest and Taxes | ($184,960) | ($108,990) | ($38,403) | $11,170 | $63,712 | $68,712 | $17,932 | ($27,606) | ($9,472) | $105,528 | $129,880 | $29,380 | |
| EBITDA | ($179,960) | ($103,990) | ($33,403) | $16,170 | $68,712 | $73,712 | $22,932 | ($22,606) | ($4,472) | $110,528 | $134,880 | $34,380 | |
| Interest Expense | $0 | $0 | $0 | $0 | $0 | $0 | $0 | $0 | $0 | $0 | $0 | $0 | |
| Taxes Incurred | ($55,488) | ($32,697) | ($11,521) | $3,351 | $19,114 | $20,614 | $5,380 | ($8,282) | ($2,842) | $31,658 | $38,964 | $8,814 | |
| Net Profit | ($129,472) | ($76,293) | ($26,882) | $7,819 | $44,598 | $48,098 | $12,552 | ($19,324) | ($6,630) | $73,870 | $90,916 | $20,566 | |
| Net Profit/Sales | -4.70% | -2.66% | -0.90% | 0.26% | 1.44% | 1.55% | 0.41% | -0.65% | -0.23% | 2.57% | 3.27% | 0.74% |
| Pro Forma Cash Flow | |||||||||||||
| Month 1 | Month 2 | Month 3 | Month 4 | Month 5 | Month 6 | Month 7 | Month 8 | Month 9 | Month 10 | Month 11 | Month 12 | ||
| Cash Received | |||||||||||||
| Cash from Operations | |||||||||||||
| Cash Sales | $2,755,080 | $2,864,880 | $2,976,892 | $3,040,880 | $3,106,000 | $3,106,000 | $3,030,412 | $2,972,200 | $2,870,000 | $2,870,000 | $2,783,600 | $2,783,600 | |
| Subtotal Cash from Operations | $2,755,080 | $2,864,880 | $2,976,892 | $3,040,880 | $3,106,000 | $3,106,000 | $3,030,412 | $2,972,200 | $2,870,000 | $2,870,000 | $2,783,600 | $2,783,600 | |
| Additional Cash Received | |||||||||||||
| Sales Tax, VAT, HST/GST Received | 0.00% | $0 | $0 | $0 | $0 | $0 | $0 | $0 | $0 | $0 | $0 | $0 | $0 |
| New Current Borrowing | $0 | $0 | $0 | $0 | $0 | $0 | $0 | $0 | $0 | $0 | $0 | $0 | |
| New Other Liabilities (interest-free) | $0 | $0 | $0 | $0 | $0 | $0 | $0 | $0 | $0 | $0 | $0 | $0 | |
| New Long-term Liabilities | $0 | $0 | $0 | $0 | $0 | $0 | $0 | $0 | $0 | $0 | $0 | $0 | |
| Sales of Other Current Assets | $0 | $0 | $0 | $0 | $0 | $0 | $0 | $0 | $0 | $0 | $0 | $0 | |
| Sales of Long-term Assets | $0 | $0 | $0 | $0 | $0 | $0 | $0 | $0 | $0 | $0 | $0 | $0 | |
| New Investment Received | $0 | $0 | $0 | $0 | $0 | $0 | $0 | $0 | $0 | $0 | $0 | $0 | |
| Subtotal Cash Received | $2,755,080 | $2,864,880 | $2,976,892 | $3,040,880 | $3,106,000 | $3,106,000 | $3,030,412 | $2,972,200 | $2,870,000 | $2,870,000 | $2,783,600 | $2,783,600 | |
| Expenditures | Month 1 | Month 2 | Month 3 | Month 4 | Month 5 | Month 6 | Month 7 | Month 8 | Month 9 | Month 10 | Month 11 | Month 12 | |
| Expenditures from Operations | |||||||||||||
| Cash Spending | $267,550 | $267,550 | $267,550 | $267,550 | $267,550 | $267,550 | $267,550 | $267,550 | $267,550 | $267,550 | $267,550 | $267,550 | |
| Bill Payments | $99,344 | $2,970,505 | $2,687,843 | $2,757,572 | $2,770,918 | $2,800,855 | $2,783,537 | $2,730,095 | $2,702,822 | $2,588,121 | $2,519,774 | $2,412,085 | |
| Subtotal Spent on Operations | $366,894 | $3,238,055 | $2,955,393 | $3,025,122 | $3,038,468 | $3,068,405 | $3,051,087 | $2,997,645 | $2,970,372 | $2,855,671 | $2,787,324 | $2,679,635 | |
| Additional Cash Spent | |||||||||||||
| Sales Tax, VAT, HST/GST Paid Out | $0 | $0 | $0 | $0 | $0 | $0 | $0 | $0 | $0 | $0 | $0 | $0 | |
| Principal Repayment of Current Borrowing | $0 | $0 | $0 | $0 | $0 | $0 | $0 | $0 | $0 | $0 | $0 | $0 | |
| Other Liabilities Principal Repayment | $0 | $0 | $0 | $0 | $0 | $0 | $0 | $0 | $0 | $0 | $0 | $0 | |
| Long-term Liabilities Principal Repayment | $0 | $0 | $0 | $0 | $0 | $0 | $0 | $0 | $0 | $0 | $0 | $0 | |
| Purchase Other Current Assets | $0 | $0 | $0 | $0 | $0 | $0 | $0 | $0 | $0 | $0 | $0 | $0 | |
| Purchase Long-term Assets | $0 | $0 | $0 | $0 | $0 | $0 | $0 | $0 | $0 | $0 | $0 | $0 | |
| Dividends | $0 | $0 | $0 | $0 | $0 | $0 | $0 | $0 | $0 | $0 | $0 | $0 | |
| Subtotal Cash Spent | $366,894 | $3,238,055 | $2,955,393 | $3,025,122 | $3,038,468 | $3,068,405 | $3,051,087 | $2,997,645 | $2,970,372 | $2,855,671 | $2,787,324 | $2,679,635 | |
| Net Cash Flow | $2,388,186 | ($373,175) | $21,499 | $15,758 | $67,532 | $37,595 | ($20,675) | ($25,445) | ($100,372) | $14,329 | ($3,724) | $103,965 | |
| Cash Balance | $2,888,186 | $2,515,010 | $2,536,509 | $2,552,267 | $2,619,799 | $2,657,395 | $2,636,720 | $2,611,275 | $2,510,903 | $2,525,232 | $2,521,509 | $2,625,473 |
| Pro Forma Balance Sheet | |||||||||||||
| Month 1 | Month 2 | Month 3 | Month 4 | Month 5 | Month 6 | Month 7 | Month 8 | Month 9 | Month 10 | Month 11 | Month 12 | ||
| Assets | Starting Balances | ||||||||||||
| Current Assets | |||||||||||||
| Cash | $500,000 | $2,888,186 | $2,515,010 | $2,536,509 | $2,552,267 | $2,619,799 | $2,657,395 | $2,636,720 | $2,611,275 | $2,510,903 | $2,525,232 | $2,521,509 | $2,625,473 |
| Inventory | $10,000 | $378,332 | $395,162 | $421,087 | $430,442 | $442,980 | $442,980 | $428,572 | $416,298 | $402,564 | $402,564 | $391,812 | $391,812 |
| Other Current Assets | $200,000 | $200,000 | $200,000 | $200,000 | $200,000 | $200,000 | $200,000 | $200,000 | $200,000 | $200,000 | $200,000 | $200,000 | $200,000 |
| Total Current Assets | $710,000 | $3,466,518 | $3,110,173 | $3,157,596 | $3,182,710 | $3,262,779 | $3,300,375 | $3,265,292 | $3,227,573 | $3,113,467 | $3,127,796 | $3,113,321 | $3,217,285 |
| Long-term Assets | |||||||||||||
| Long-term Assets | $2,000,000 | $2,000,000 | $2,000,000 | $2,000,000 | $2,000,000 | $2,000,000 | $2,000,000 | $2,000,000 | $2,000,000 | $2,000,000 | $2,000,000 | $2,000,000 | $2,000,000 |
| Accumulated Depreciation | $0 | $5,000 | $10,000 | $15,000 | $20,000 | $25,000 | $30,000 | $35,000 | $40,000 | $45,000 | $50,000 | $55,000 | $60,000 |
| Total Long-term Assets | $2,000,000 | $1,995,000 | $1,990,000 | $1,985,000 | $1,980,000 | $1,975,000 | $1,970,000 | $1,965,000 | $1,960,000 | $1,955,000 | $1,950,000 | $1,945,000 | $1,940,000 |
| Total Assets | $2,710,000 | $5,461,518 | $5,100,173 | $5,142,596 | $5,162,710 | $5,237,779 | $5,270,375 | $5,230,292 | $5,187,573 | $5,068,467 | $5,077,796 | $5,058,321 | $5,157,285 |
| Liabilities and Capital | Month 1 | Month 2 | Month 3 | Month 4 | Month 5 | Month 6 | Month 7 | Month 8 | Month 9 | Month 10 | Month 11 | Month 12 | |
| Current Liabilities | |||||||||||||
| Accounts Payable | $0 | $2,880,990 | $2,595,938 | $2,665,243 | $2,677,538 | $2,708,010 | $2,692,507 | $2,639,872 | $2,616,477 | $2,504,002 | $2,439,461 | $2,329,069 | $2,407,468 |
| Current Borrowing | $0 | $0 | $0 | $0 | $0 | $0 | $0 | $0 | $0 | $0 | $0 | $0 | $0 |
| Other Current Liabilities | $0 | $0 | $0 | $0 | $0 | $0 | $0 | $0 | $0 | $0 | $0 | $0 | $0 |
| Subtotal Current Liabilities | $0 | $2,880,990 | $2,595,938 | $2,665,243 | $2,677,538 | $2,708,010 | $2,692,507 | $2,639,872 | $2,616,477 | $2,504,002 | $2,439,461 | $2,329,069 | $2,407,468 |
| Long-term Liabilities | $0 | $0 | $0 | $0 | $0 | $0 | $0 | $0 | $0 | $0 | $0 | $0 | $0 |
| Total Liabilities | $0 | $2,880,990 | $2,595,938 | $2,665,243 | $2,677,538 | $2,708,010 | $2,692,507 | $2,639,872 | $2,616,477 | $2,504,002 | $2,439,461 | $2,329,069 | $2,407,468 |
| Paid-in Capital | $7,960,000 | $7,960,000 | $7,960,000 | $7,960,000 | $7,960,000 | $7,960,000 | $7,960,000 | $7,960,000 | $7,960,000 | $7,960,000 | $7,960,000 | $7,960,000 | $7,960,000 |
| Retained Earnings | ($5,250,000) | ($5,250,000) | ($5,250,000) | ($5,250,000) | ($5,250,000) | ($5,250,000) | ($5,250,000) | ($5,250,000) | ($5,250,000) | ($5,250,000) | ($5,250,000) | ($5,250,000) | ($5,250,000) |
| Earnings | $0 | ($129,472) | ($205,766) | ($232,647) | ($224,829) | ($180,230) | ($132,132) | ($119,580) | ($138,904) | ($145,534) | ($71,665) | $19,251 | $39,817 |
| Total Capital | $2,710,000 | $2,580,528 | $2,504,234 | $2,477,353 | $2,485,171 | $2,529,770 | $2,577,868 | $2,590,420 | $2,571,096 | $2,564,466 | $2,638,335 | $2,729,251 | $2,749,817 |
| Total Liabilities and Capital | $2,710,000 | $5,461,518 | $5,100,173 | $5,142,596 | $5,162,710 | $5,237,779 | $5,270,375 | $5,230,292 | $5,187,573 | $5,068,467 | $5,077,796 | $5,058,321 | $5,157,285 |
| Net Worth | $2,710,000 | $2,580,528 | $2,504,234 | $2,477,353 | $2,485,171 | $2,529,770 | $2,577,868 | $2,590,420 | $2,571,096 | $2,564,466 | $2,638,335 | $2,729,251 | $2,749,817 |
| General Assumptions | |||||||||||||
| Month 1 | Month 2 | Month 3 | Month 4 | Month 5 | Month 6 | Month 7 | Month 8 | Month 9 | Month 10 | Month 11 | Month 12 | ||
| Plan Month | 1 | 2 | 3 | 4 | 5 | 6 | 7 | 8 | 9 | 10 | 11 | 12 | |
| Current Interest Rate | 6.00% | 6.00% | 6.00% | 6.00% | 6.00% | 6.00% | 6.00% | 6.00% | 6.00% | 6.00% | 6.00% | 6.00% | |
| Long-term Interest Rate | 10.00% | 10.00% | 10.00% | 10.00% | 10.00% | 10.00% | 10.00% | 10.00% | 10.00% | 10.00% | 10.00% | 10.00% | |
| Tax Rate | 30.00% | 30.00% | 30.00% | 30.00% | 30.00% | 30.00% | 30.00% | 30.00% | 30.00% | 30.00% | 30.00% | 30.00% | |
| Other | 0 | 0 | 0 | 0 | 0 | 0 | 0 | 0 | 0 | 0 | 0 | 0 |