

LivePlan’s Black Widow Update is Here
Posted By
Firstly, what’s with our update names?
We figured we’d better give you the low-down now. After all, you’re going to wonder why on earth your next update comes to you as “Cyclops”…
At LivePlan, we do our product development work in the form of user stories, which are assigned to numbered sprints (in the Scrum method of agile software development, a sprint is a regular, repeatable work cycle). This week is the start of sprint 69. In some cases, though, stories go live in a different release than the one that immediately follows that sprint.
To avoid confusion, we started using alphabetical designations for releases. A release called 2014-A wouldn’t be very easy to remember or much fun. So, we kicked around a few naming schemes.
In the end, “musical guests who appeared on the Simpsons” lost out to “characters created by Stan Lee.” Hence the recent releases of AntMan and BlackWidow, to be followed soon by Cyclops, Daredevil, and Electro.
Not everyone on the team was thrilled though and one team member who sees Marvel as inferior to DC Comics, left this book on the team lead’s desk the next day:

The type of question a LivePlan developer contemplates: Marvel or DC – Who would win in a fight?
Now, on with the serious stuff…
The Black Widow Update makes performance monitoring easier than ever
Even though we’ve only just launched our first round of major updates to LivePlan’s Dashboard feature, we’re not sitting back and taking it easy.
Our latest product update adds enhancements to the Dashboard feature, giving you more flexibility and making it easier for you to track and understand your financial performance.
Based on early feedback from Dashboard users, we’ve added some additional chart options so you can better visualize your financial data and get an improved view of your business’s health.
New line charts
If you want to see your revenue forecast or expense budget compared simultaneously to your actual results, your results from last year, and your results from the previous period, you can use the Dashboard’s new line chart option.
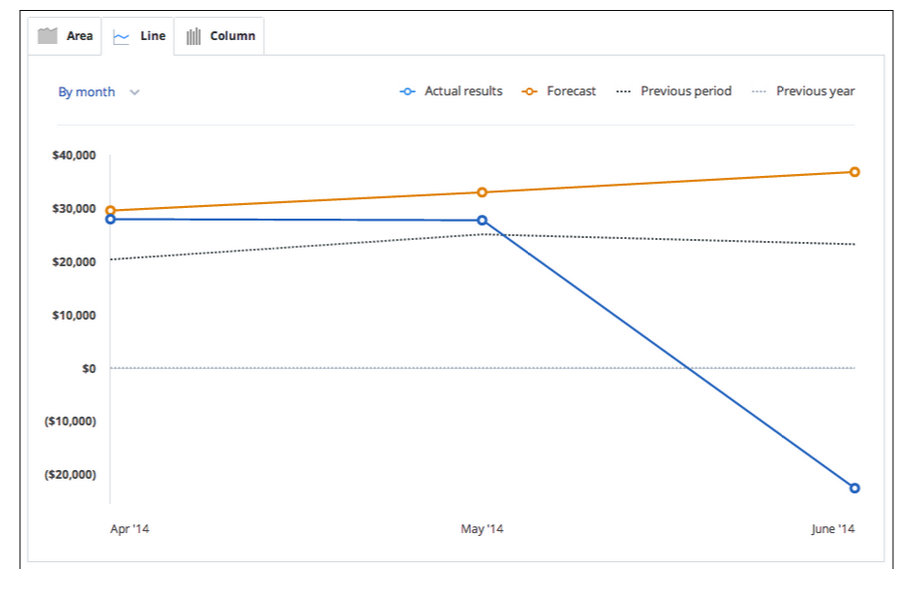
Not only does the new line chart do a great job of showing you all of your key comparison points in one place, it also gives you access to your upcoming forecast and last year’s results. Using this chart view, you can easily look ahead to see your forecast for the next few months, and to get an overview of what happened last year over the same period of time.
This feature is especially useful if your business is seasonal, or if looking ahead with a particular period in mind is important. If you’ve forecasted a sudden growth in sales, having a vision into the future and easy access to those target numbers will allow you to prepare your team and your strategy so that you can stay on track for the growth you expect.
New thermometer charts
As you monitor the progress of your business during the current month or quarter, it’s useful to see which revenue streams are performing according to plan and which ones need some extra work.
To solve this problem, we’ve added a thermometer (or “thermo” chart) chart view. Now you can see exactly where you are exceeding expectations and where you may need to re-adjust your plan.

The thermo chart doesn’t limit you to comparing your performance with your plan. You can also use it to gain insight into how you are performing in comparison to the same time period last year or to a previous period – say last month or last quarter.

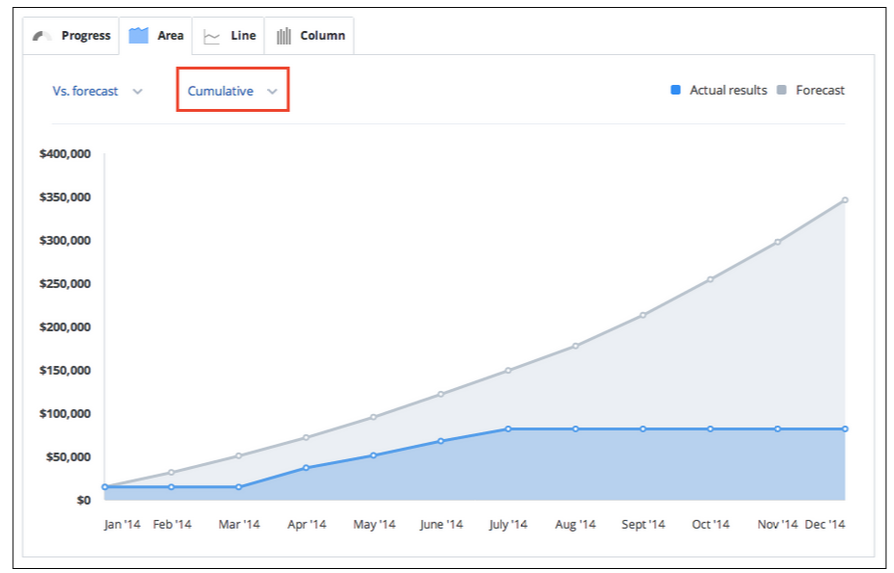
New cumulative view for area, column, and line charts
Finally, if you want an overview of your cumulative performance, you’ve now got the option of choosing to view your progress over a specific period of time.
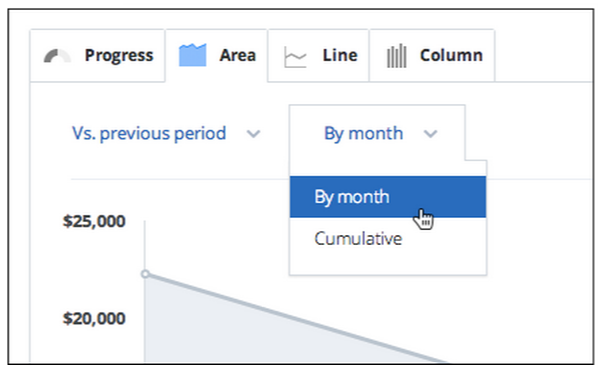
If you choose this option, you’ll get a chart that shows you your total revenue or total expenses as they have accumulated over time. Switching back to the “by month” option will show you the standard monthly totals for each month.
More coming soon!
We hope that the Dashboard is helping you put together a solid financial dashboard for your business so that you can more easily track your progress as you grow.
What do you think so far?
We always want to hear your feedback. It’s the only way we can improve and give you the product you want. Let us know what kinds of features you’d like to see in LivePlan. You can add a comment below, call us at 1-888-498-6136, or email help@liveplan.com
