
How to Read and Analyze Your Income Statement (Profit and Loss)


Jump to

What is the income statement?
Your income statement, or profit and loss statement (P&L), is the most common financial statement in any business plan. It’s also the financial statement that bankers and investors will flip to first when reviewing your business plan.
Think of the income statement as your business’s report card.
The P&L tells you if your company is profitable or not. It starts with a summary of your revenue, details your costs and expenses, and then shows the all-important “bottom line”—your net profit. Want to know if you’re in the red or in the black? Just flip to your P&L and look at the bottom.
If you’re looking for an easier way to update or build an income statement, you can download a free profit and loss template or skip the spreadsheets and use planning software such as LivePlan.
Is a profit and loss statement the same as an income statement?
Yes. A profit and loss statement (P&L) and an income statement are the same financial report: a summary of your revenue, costs, and expenses over a period of time, ending in your net profit or loss.
Ever feel like you should know what a P&L is but you’re not quite sure? How about when the talk turns to income statements, or profit and loss reports, or even a “statement of activities”? If you aren’t an accountant or don’t have a business degree, it can feel intimidating to hear all these finance terms. The good news is that all of these refer to the same thing, so you may not have as much to learn as you thought.
You may also see it called a statement of operations or a statement of earnings. Nonprofits usually call it a statement of activities. The name changes, but the structure doesn’t: money coming in at the top, costs and expenses in the middle, and profit or loss at the bottom.
How an income statement works
In its most basic form, an income statement is pretty straightforward. Here is a very simple example of a child selling candy as a “business”:
Revenue (or Sales): Allowance | $2.00 |
Expenses: Candy | $1.50 |
Net Income (or Net Profit) | $0.50 |
See how that works? The top section lists money coming in during the period, the middle section lists money going out, and the bottom line is the difference between the two. All the math you need to produce or proofread this statement is a little basic subtraction.
Most businesses have more detailed income statements than this simple example, but they work exactly the same way. They just have more lines. Let’s get into the details.
What goes into an income statement?
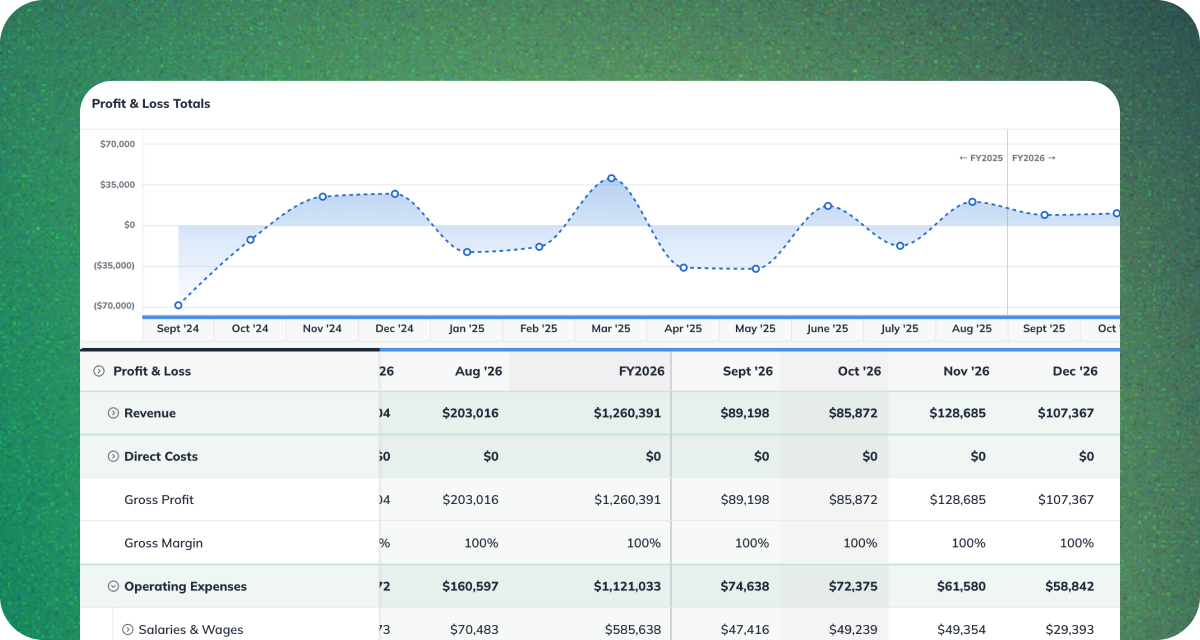
Unlike the cash flow statement, which can be a bit complicated, your P&L is fairly easy to read and understand. Here’s a quick run-down and explanation of what each section means and where the numbers come from.
Revenue
Revenue, also called the “top line” of the P&L, is the money that you’re bringing in from your sales.
If you’re a non-profit, this would be money raised from fundraising or program activities. Usually, a company will track their sales and then bring the total sales or revenue number over to the P&L.
Of course, revenue is a pretty critical number as it’s how your business makes money and the only way you can cover your expenses. The lower your revenue number, the lower your expenses need to be in order to stay profitable.
Direct costs
Direct costs, also known as cost of goods sold (COGS) or cost of revenue, are the costs that you incur when you make your products or deliver your services. You don’t include things like rent or payroll here, but you would include the things that directly contribute to each sale.
For example, for a bike shop, the direct cost of every sale is what the shop paid to buy the bikes from the manufacturer. For a bike manufacturer, direct costs would include the cost of the metal and plastic and labor hours used to make the bike.
However, if you’re a consultant, it’s possible that you have very low or even no direct costs. You might have costs associated with printing reports and photocopying, or maybe you pay commission to a sales person to sell your consulting services, but not many other costs.

Gross profit and gross margin
Gross profit tells you how much money you have left over to cover your expenses after you’ve covered the cost of the product or service you are selling. Simply subtract your direct costs from your revenue.
Revenue – Direct Costs = Gross Profit
For example, if you buy a widget for $1 and sell it for $3, your gross profit would be $2.
Gross margin represents that number as a percentage—the higher the number, the better. You calculate it by dividing your gross profit by revenue:
Gross Profit / Revenue = Gross Margin %
When you have a high gross margin, that means that it costs you very little to deliver your product or service and you’ll have the majority of the money from every sale left over to cover your expenses.
Operating expenses
Operating expenses cover all of the expenses that you incur to keep your doors open, excluding your direct costs that we talked about earlier.
This usually includes your rent, salaries and benefits, marketing expenses, research and development expenses, utilities, and so on. Don’t include the interest you pay on loans or taxes here, though.
EBITDA
EBITDA (earnings before interest, taxes, depreciation, and amortization) is calculated by subtracting total operating expenses from your gross profit.
Gross Profit – Total Operating Expenses = EBITDA
Some income statements subtract depreciation and amortization first and call the result operating income, or EBIT (earnings before interest and taxes). Either way, it shows how much the core business earns before financing costs and taxes.
Interest
Here’s where you’ll include interest payments that your company is making on any outstanding loans.
Depreciation and amortization
These are special expenses associated with assets that your company owns. Over time, assets (like vehicles and large pieces of equipment) lose their value or depreciate. You’ll expense that decline in value here.
Taxes
Income taxes that you pay or expect to pay on your profits show up here. Sales tax you collect from customers isn’t a P&L expense; you’re holding it for the government.
Net profit
Also known as net income or net earnings, it’s the “bottom line” that you hear so much about. You started with your revenue as your “top line” and then subtracted things as you went: direct costs, operating expenses, and so on. What’s left over is your profit, or potentially your loss if you ended up spending more than you earned.
If the bottom line is a negative number, it will most often be called a “deficit” or “loss.” The math and the meaning are exactly the same. A negative net profit means the business is not making money. Hopefully that means it is not making money YET, and you have plans to grow your sales and actually turn a profit. It is fairly common to see negative net profit in a startup, or an existing business that is investing in growth. But there has to be a plan for profitability, or there is no viable business.
Income statement vs. balance sheet vs. cash flow statement
The income statement shows whether you made a profit over a period of time. The balance sheet shows what you own and owe at a single point in time, and the cash flow statement shows how cash actually moved in and out.
Income statement (P&L) | Balance sheet | Cash flow statement | |
|---|---|---|---|
What it shows | Revenue, costs, expenses, and profit | Assets, liabilities, and equity | Cash coming in and going out |
Time frame | A period (month, quarter, year) | A single point in time | A period (month, quarter, year) |
Question it answers | Did we make a profit? | What do we own and owe? | Do we have enough cash? |
What it can’t tell you | Whether you have cash in the bank, or what you own and owe | Whether you were profitable over a period | Whether you were profitable |
What your income statement won’t tell you is whether your overall financial condition is weak or strong (refer to your balance sheet for this), how cash is actually moving in and out of your business (refer to your cash flow statement), or list any assets you own or liabilities you owe (again, see your balance sheet).
The three main financial statements are interrelated. Viewing them holistically can help you make smart financial, investment, and management decisions for your business.
That’s why a financial forecast built as a connected three-statement model is easier to trust than three separate spreadsheets: a change to your revenue flows through to your P&L, cash flow, and balance sheet automatically. If you take the time to create a financial forecast for your business, then take the time to do it the right way, and link those three forecasted statements together so that you can build “what if” scenarios and find out what happens to the business if you sell more or less than expected.
How to review and analyze an income statement
If you’re asked to review an income statement and you’re not sure where to start, here are a few things to do:
1. Find the bottom line
It should be easy—it’s at the bottom. On a very basic level, it’s good to see a positive number there. That means the company earned more than it spent during this period. But if that bottom line is preceded by a minus sign, or printed in red, or enclosed in parentheses, then expenses exceeded revenue. Find out why, and what the plan is for making the red turn to black.
A net loss once in a while does not necessarily imply disaster. Sometimes new companies have a lot of start-up costs and do not expect to turn a profit in the first year or three. Or maybe the business is a cyclical one, like agriculture. On the other hand, if net losses become a trend, or if the company does not have enough cash to fund its expenses during the down times, there could be a problem.
2. Look at the sources of income
Do they make sense for the business? For example, if you’re in the cotton candy business, then sales income from the county fair sounds right. But if one income line is “gifts from friends,” that’s probably not sustainable. What about next year when those friends don’t come through again?
3. Look at the expense categories
Are they logical? For most businesses, you will see salaries and wages, insurance, rent, supplies, interest, and at least a few other things. Is anything missing that you would expect to see? For example, if the business has a hundred employees and you don’t see rent, find out why.
4. Look at the biggest expenses
If this is a service business, expect to see a large number for salaries. If it’s a manufacturing business, materials and supplies may logically be a significant total. On the other hand, what if you know the company has only three employees but the salary line is extremely high? Or the company has been profitable for years but you see high interest expenses? Find out why.
5. Compare year-over-year numbers
Usually, the income statement will have a separate column showing the figures for the prior year. If the document doesn’t already show the percentage change in every category, calculate those numbers yourself. Question any significant changes. Why is sales income 50 percent lower this year than last? Why is insurance 20 percent lower? Maybe a policy was canceled and the company is at risk in some way.
6. Compare to the budget and forecast
Well-run businesses will have an expense budget and revenue forecast. If this is available, compare the actual income statement to the budget and forecast and look for numbers that are substantially different. You’ll want to see if the business is making its sales targets and if its costs are staying in control.
If you connect your accounting software, LivePlan’s budget vs. actual dashboards show where spending ran over plan and explain what changed.
7. Think about logical relationships between numbers
For example, at most companies employee benefits (like health insurance and retirement plan contributions) are a significant cost. If the salary line doubled but the benefits number went up by only 10 percent, that should strike you as odd. Did the company drop one of its benefit plans?
All these questions may have perfectly reasonable answers, but sorting through them will help you understand what’s going on. Revenue minus expenses equals the bottom line. Everything else is details.
Profits are not the same as cash
That’s your profit and loss statement explained. But, don’t forget: Profits are not the same as cash. Just because you made a profit doesn’t mean that money is actually in the bank. You’ll want to dive into your cash flow statement to better understand the difference and how to maintain a healthy cash position.
Build your P&L automatically
When you’re building a forecast, it’s much easier to let LivePlan create your income statement for you. Tell it what you sell, what you charge, and who you’ll hire, and it builds a connected profit and loss, cash flow statement, and balance sheet, with no formulas to maintain.
If you’d rather start on your own, download our free Profit and Loss Template.
Business financial resources
For more business and financial concepts made simple, check out our articles covering:
Frequently asked questions
Yes. A profit and loss statement and an income statement are the same report, showing revenue, costs, expenses, and net profit over a period of time.
An income statement shows whether you made a profit over a period, like a month or a year. A balance sheet shows what your business owns, owes, and is worth at a single point in time.
The bottom line is your net profit, or net income: what’s left after subtracting direct costs, operating expenses, interest, depreciation, and taxes from revenue. If the number is negative, it’s a net loss.
Gross profit is revenue minus direct costs, before operating expenses. Net profit is what’s left after all costs, expenses, interest, and taxes are subtracted.
Monthly is a good rhythm for most small businesses. Compare each month to the prior year and to your budget to spot problems early.

Noah Parsons
Before joining Palo Alto Software, Noah Parsons was an early Internet marketing and product expert in the Silicon Valley. He joined Yahoo! in 1996 as one of its first 101 employees and become Producer of the Yahoo! Employment property as part of the Yahoo! Classifieds team before leaving to serve as Director of Production at Epinions.com. He is a graduate of Princeton University.Noah devotes most of his free time to his three young sons. In the winter you'll find him giving them lessons on the ski slopes, and in summer they're usually involved in a variety of outdoor pursuits.Noah is currently the COO at Palo Alto Software, makers of the online business plan app LivePlan.